
Article 2 – Formatting a Financial Model: How to make your financial model more intuitive
Introduction:
In our last article, we explored the topic of planning and structuring our financial model. In today’s article, we will discuss the topic of improving a financial model’s intuitiveness and clarity through formatting.
Formatting a Financial Model
Formatting is not a particularly complex task, but it is also a somewhat refined art; an experienced professional can often tell whether a financial model comes from a top bulge bracket investment bank or a lower tier boutique bank simply by observing its formatting.
Although a perfectly formatted model does not necessarily imply an accurate model, a poorly formatted model can convey a lack of attention to detail, professionalism, and even competence, allowing an otherwise well-structured model to be disregarded by those too busy to look under the hood.
Take for example, the two worksheets below. Both screenshots are models with the exact same data, but our left image (our poorly formatted/structured example), reads substantially less reliable and trustworthy.
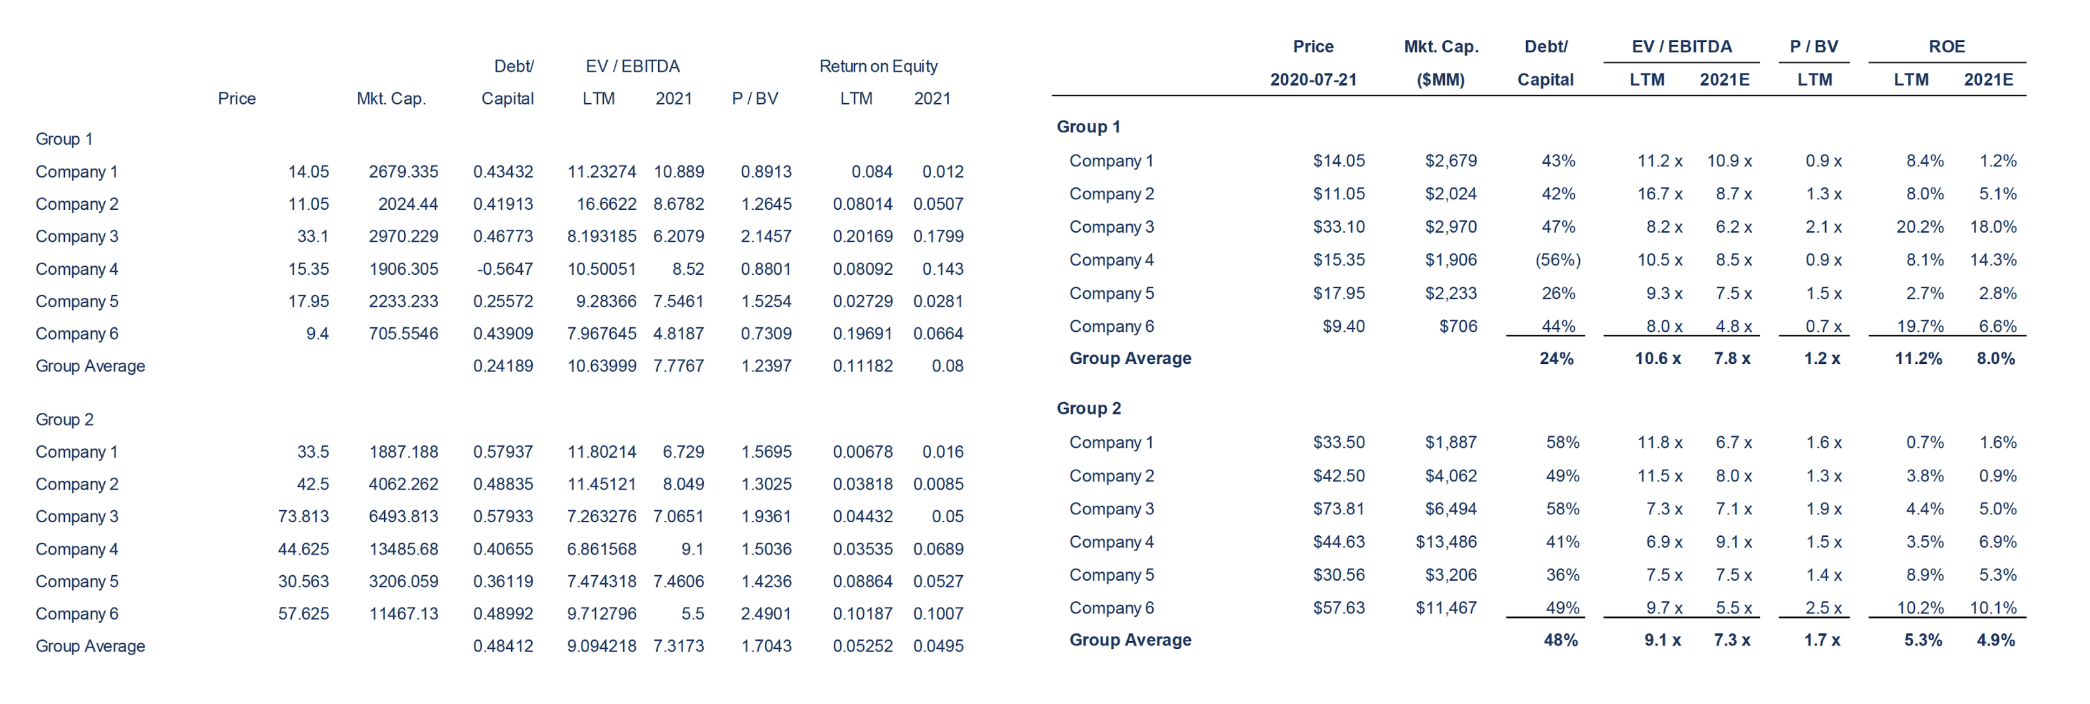
Our first goal is to meet industry formatting standards and our model to present as legible, organized, and professional.
Color Coding Cells
Any modeler’s first task should be to correctly color code their cells:
- Hardcodes should be blue;
- References to other schedules/sheets should remain green;
- Formulas should be black; and
- Links to other workbooks should be red.
Aside from the obvious benefits of clarity, color coding makes the model easier to navigate, easier to visually consume, and easier to audit.
Cell Formatting
Once cells are color coded, a modeler’s next step should be to improve cell formatting. Cell readability is made up of a number of small factors that work together additively:
- Standard fonts: Begin with ensuring that your model uses only one font size and font (eg Arial, Times New Roman, Aptos Narrow).
- Standardize your number formats: If you are using one decimal place across a schedule, ensure all line items use one decimal place. (Look into conditional formatting tips to ensure that your cells always take up the same number of columns and that the decimals line up.)
- Brackets around negatives: Make sure negative numbers are formatted to display brackets rather than negative signs
- Bold titles and sums: Bold any rows that are sums or titles
- Standardize column width across years: Ensure that your year columns are all are the same width
- Include unit measurements: Always include units of measurement for your numbers – it’s often good practice to give units their own column
- Always include denominators – Currency symbols, and other useful denominators (x for multiples, % signs, etc.) to improve scanability
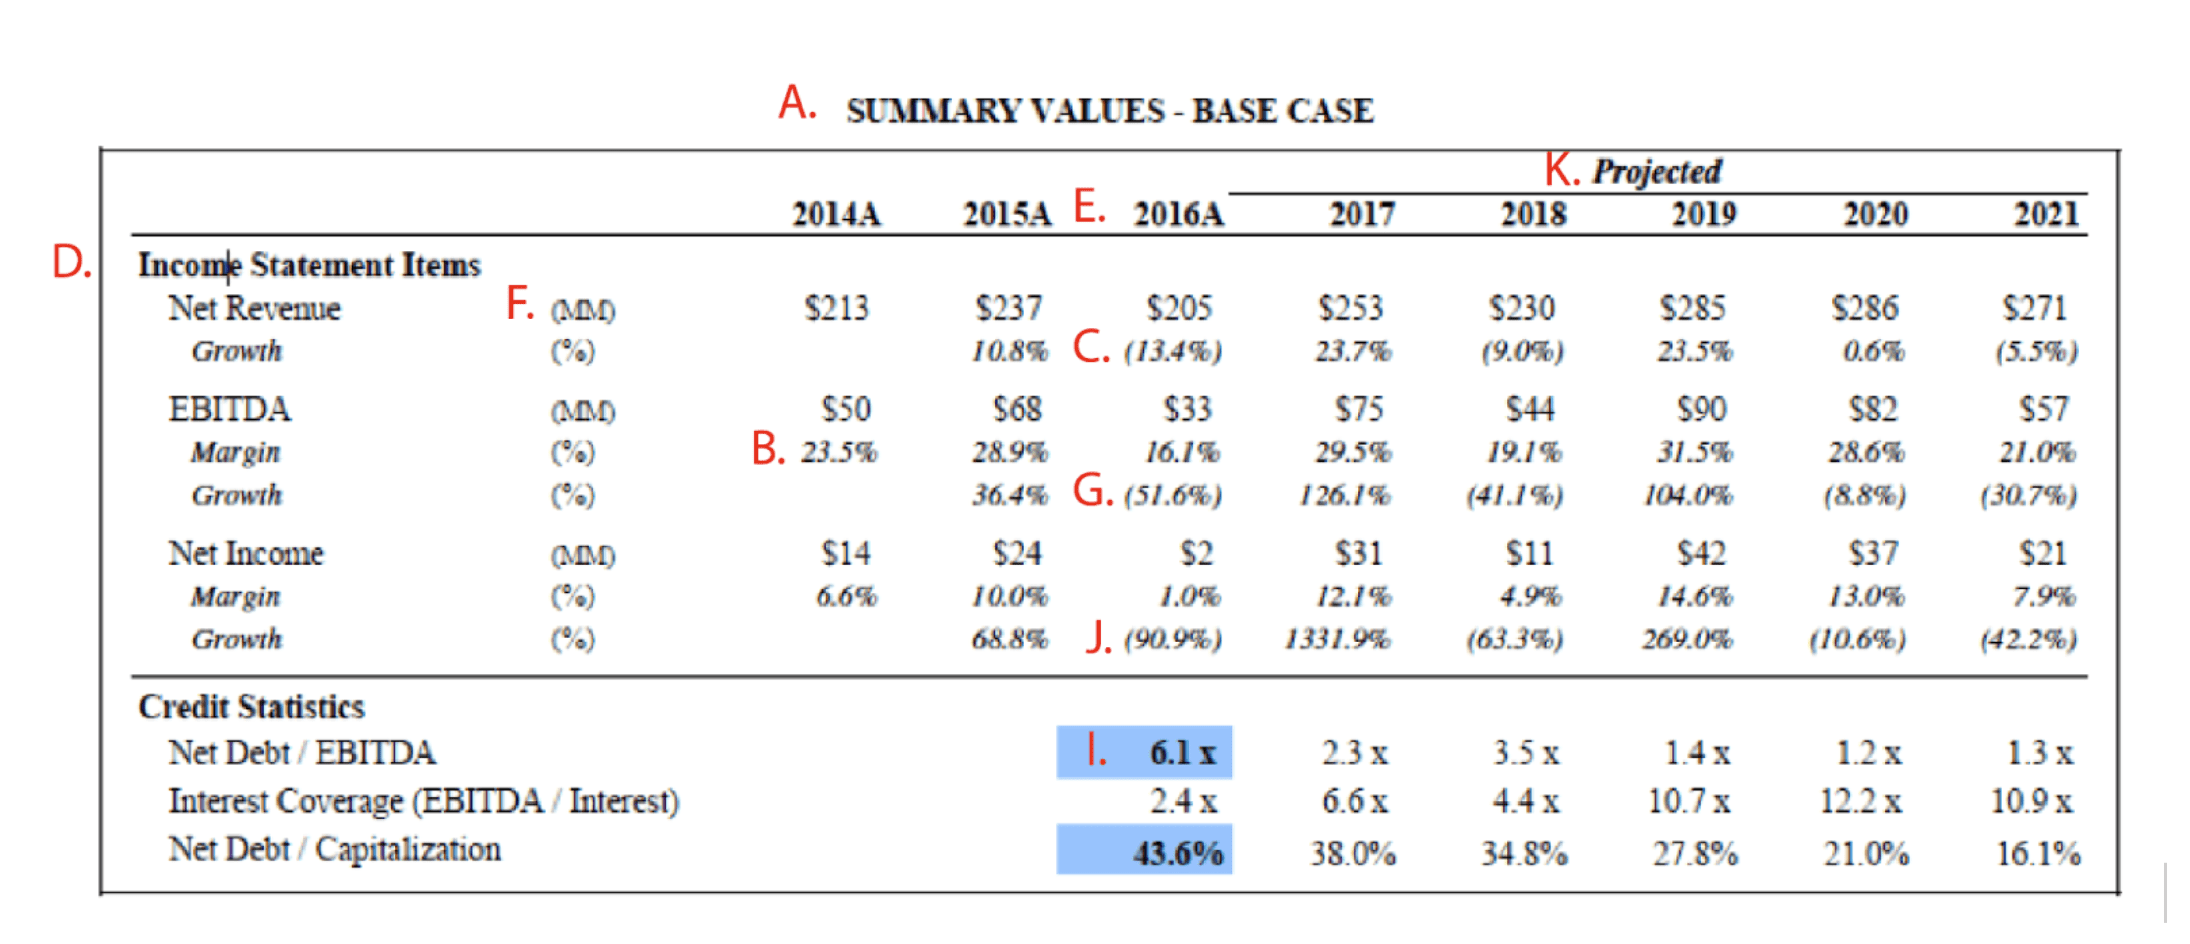
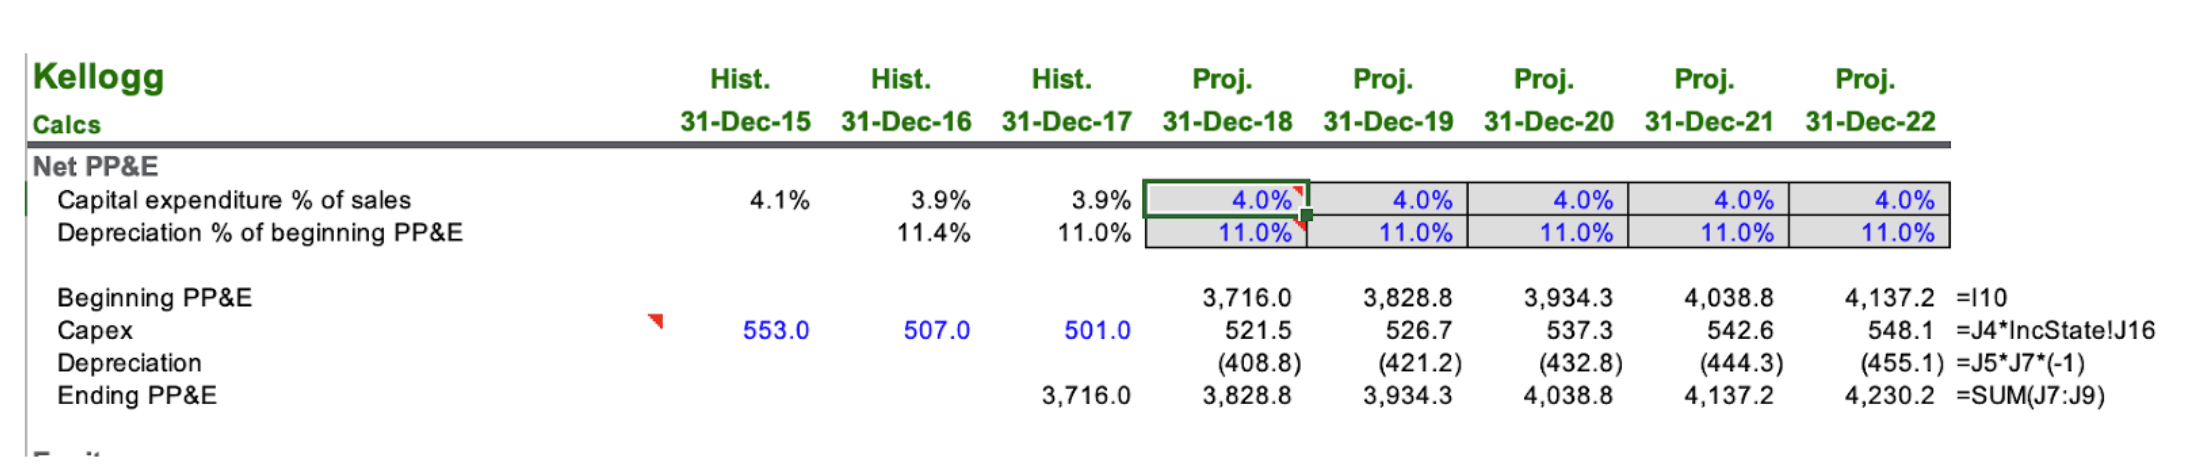
- Stylize important numbers: Summed numbers should generally have borders, Key numbers should be bolded, Percentages should be italicized
- Properly denote historical vs projected: Historical and forecast/projected years should always be labeled clearly
- Consider removing gridlines: For larger workbooks, consider remove gridlines for a cleaner look
Organizing, Borders, and adding visual hierarchy to your model
Once you’ve tackled individual cell formatting, your next focus should be improving how your model visually groups information. This is where experience helps. Truly, the best way to improve your spacing and use of borders is to see sample professional models from a reputable source and study them.
Some general best practices for improving spacing:
- Use print mode: Leave as much whitespace between the your row of titles on the left, and the numbers on the right as possible.
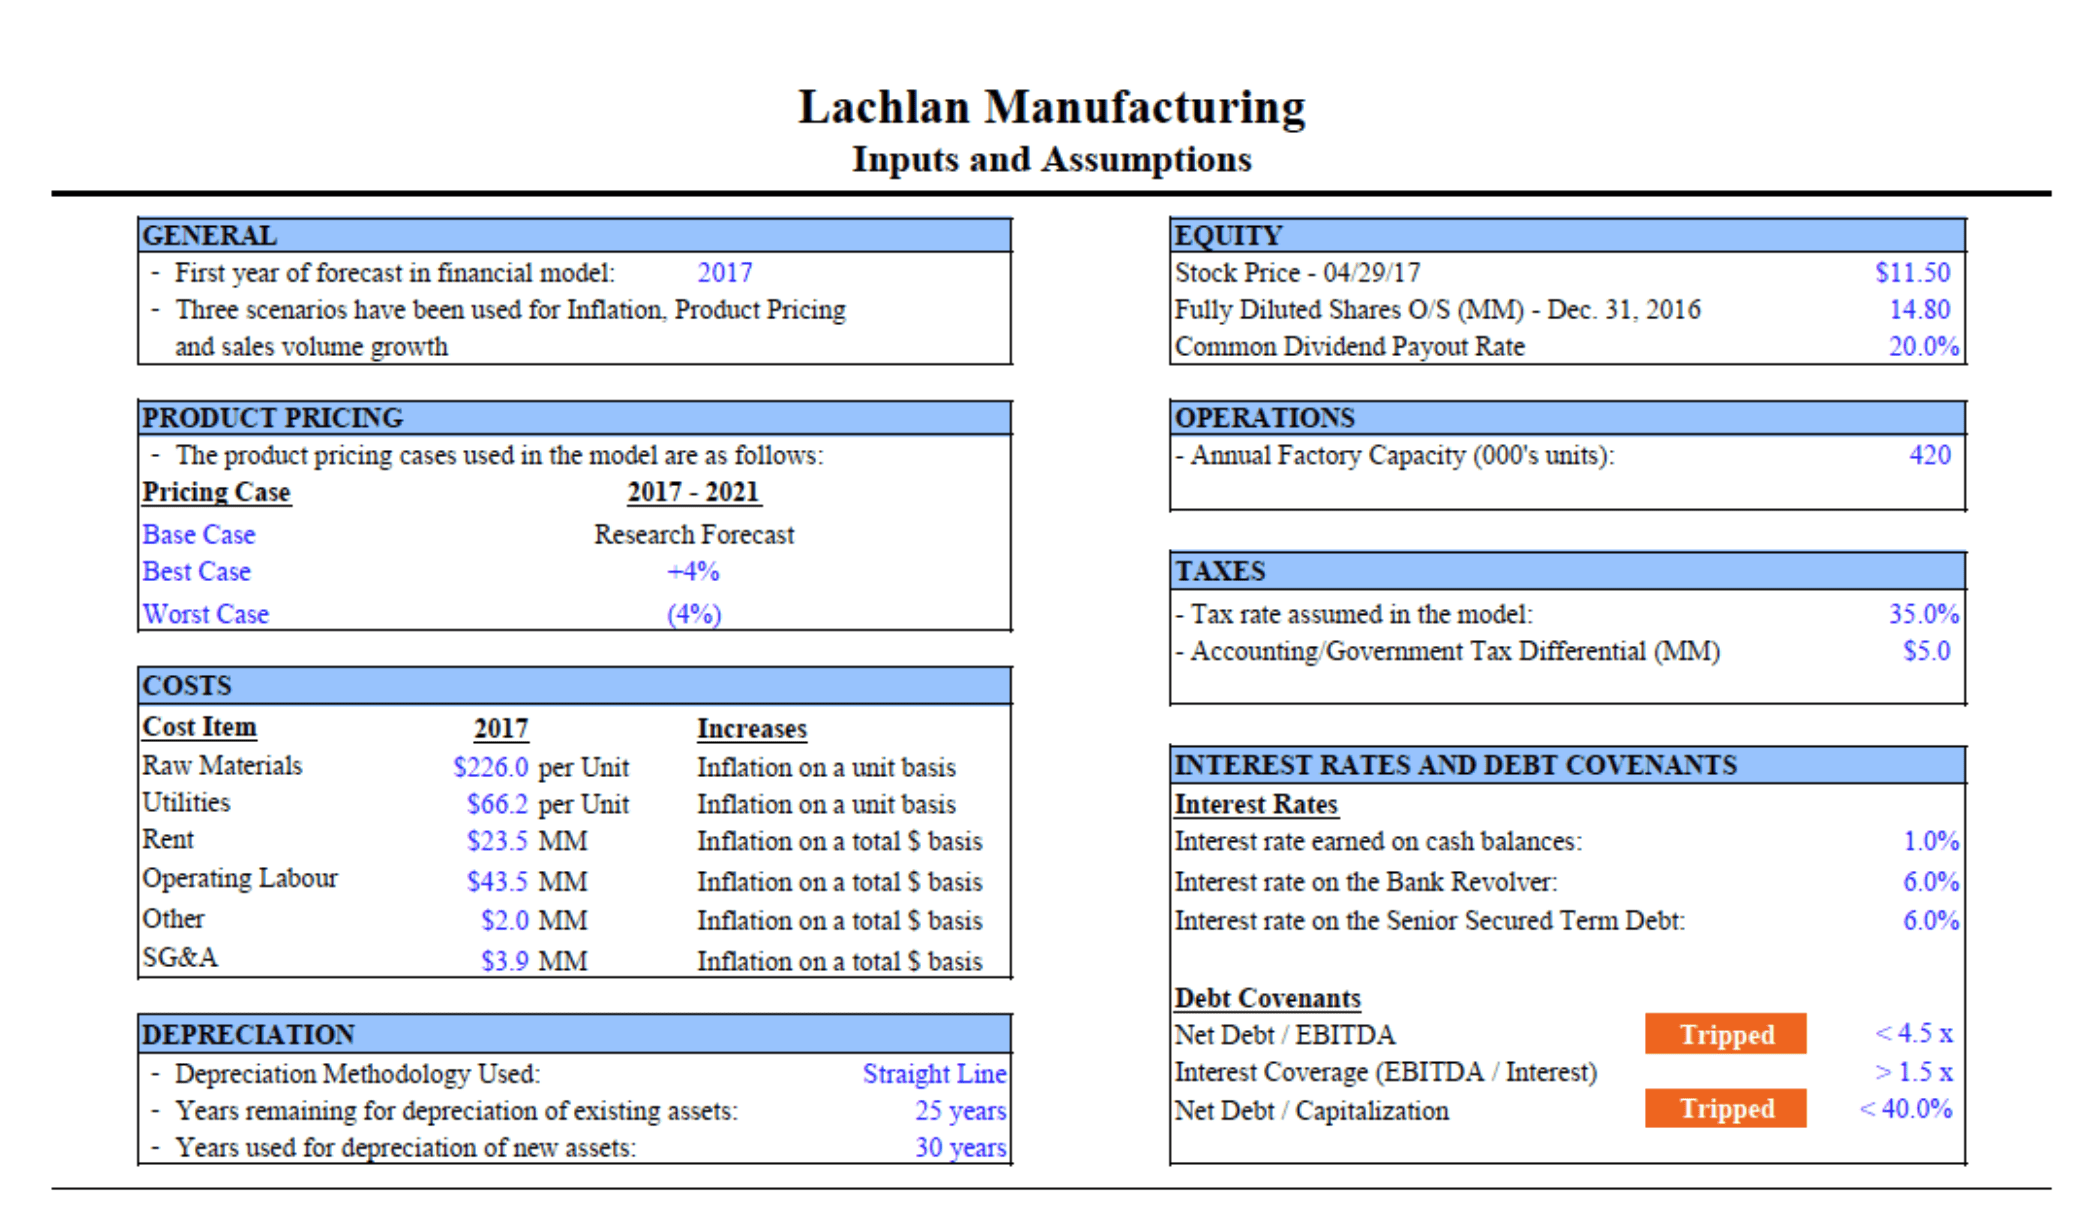
- Group related information into boxes: this improves scanability and guides stakeholders to important information and facilitate.
- Use small borders: When in doubt, use 1px borders within your models. Leave thicker borders for separating headers and footers.
- Separate sections of your model: Consider using a border that crosses the entire sheet when you need to clearly separate sections of the model (for example, unit projections vs $$ projections).
- Use indents: If tables group sections of data, use visual indents to break up the lines. Parent/child hierarchies greatly improve readability.
- Don’t merge cells: Merging cells cause a number of issues with formulas. Use centre across selection instead.
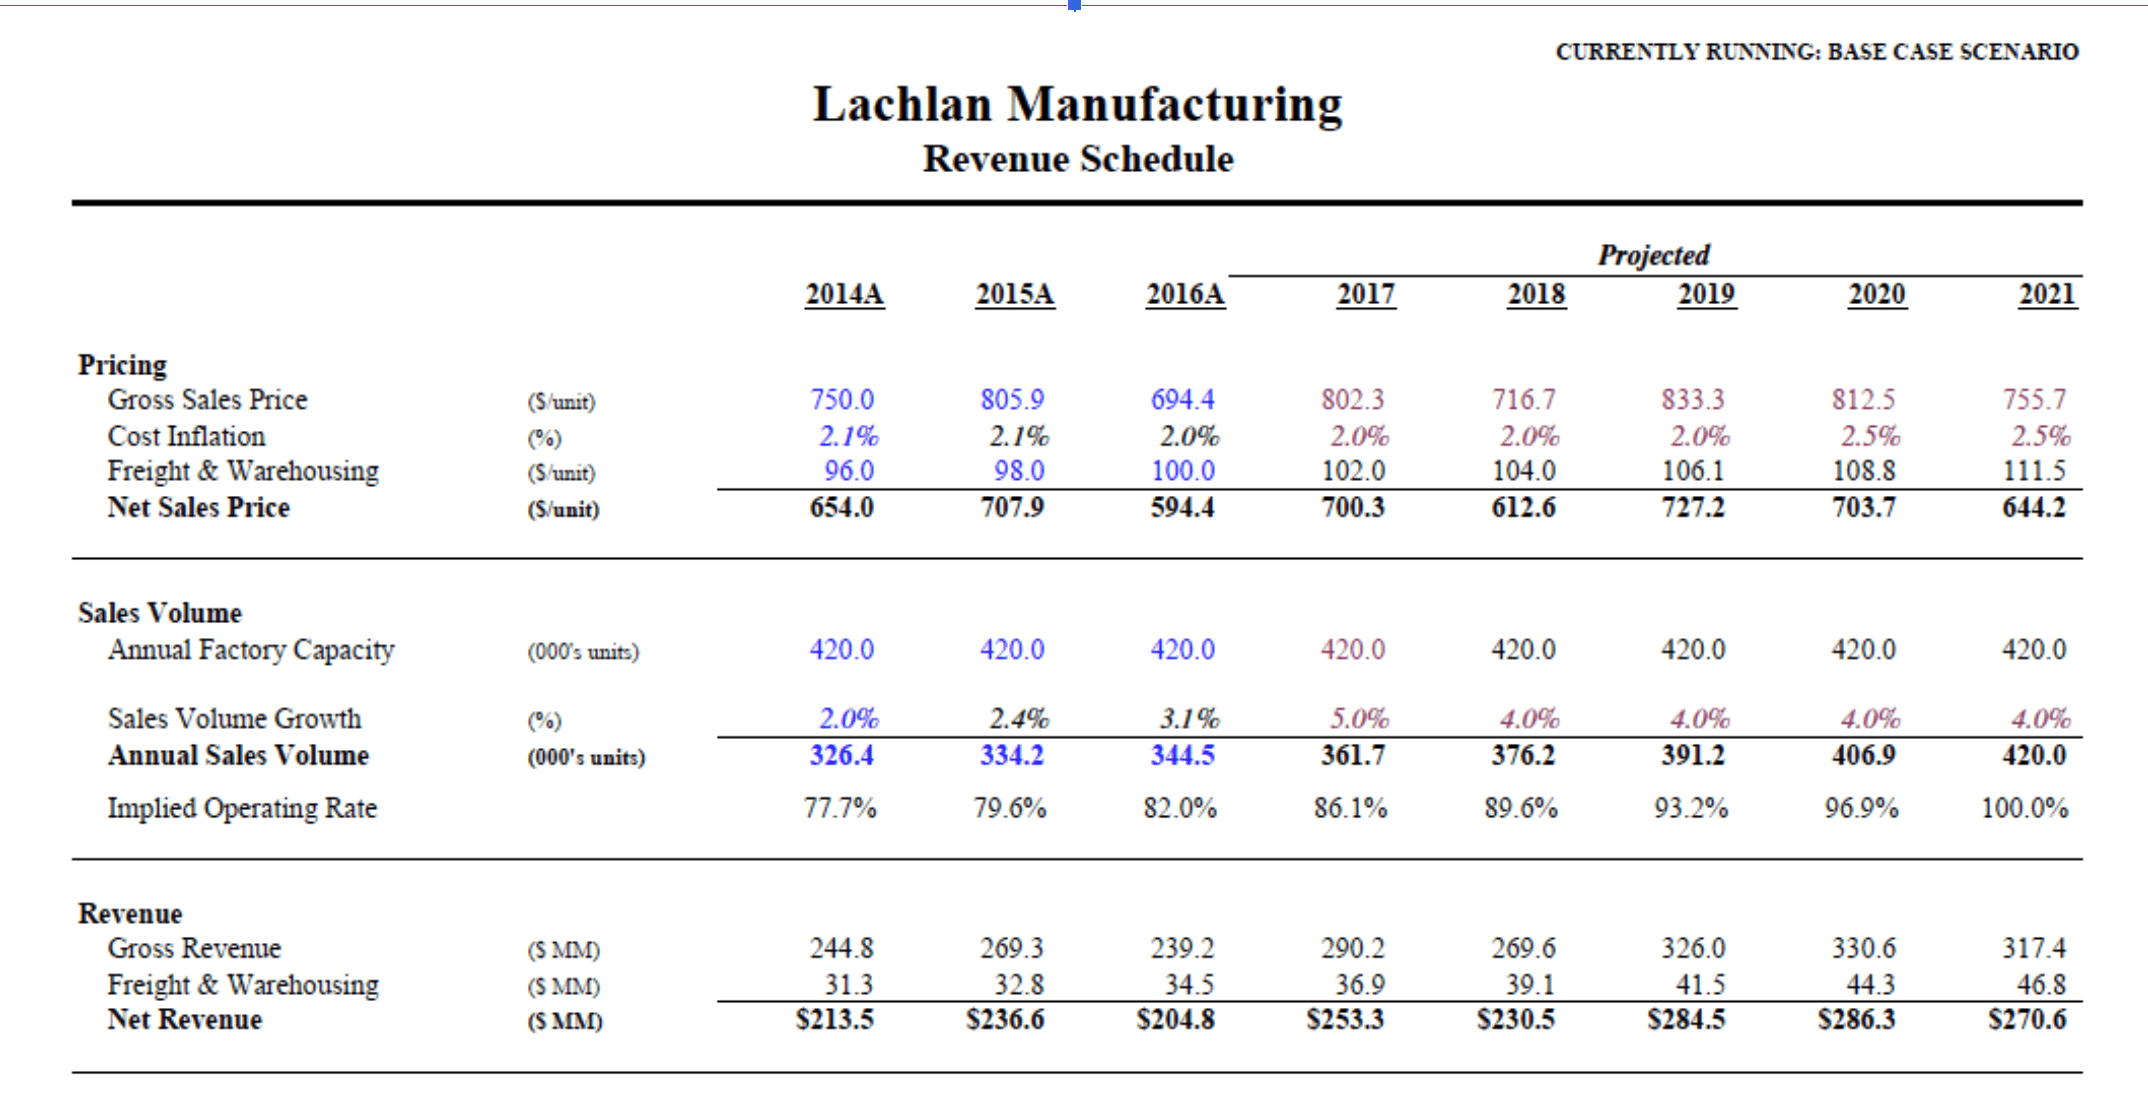
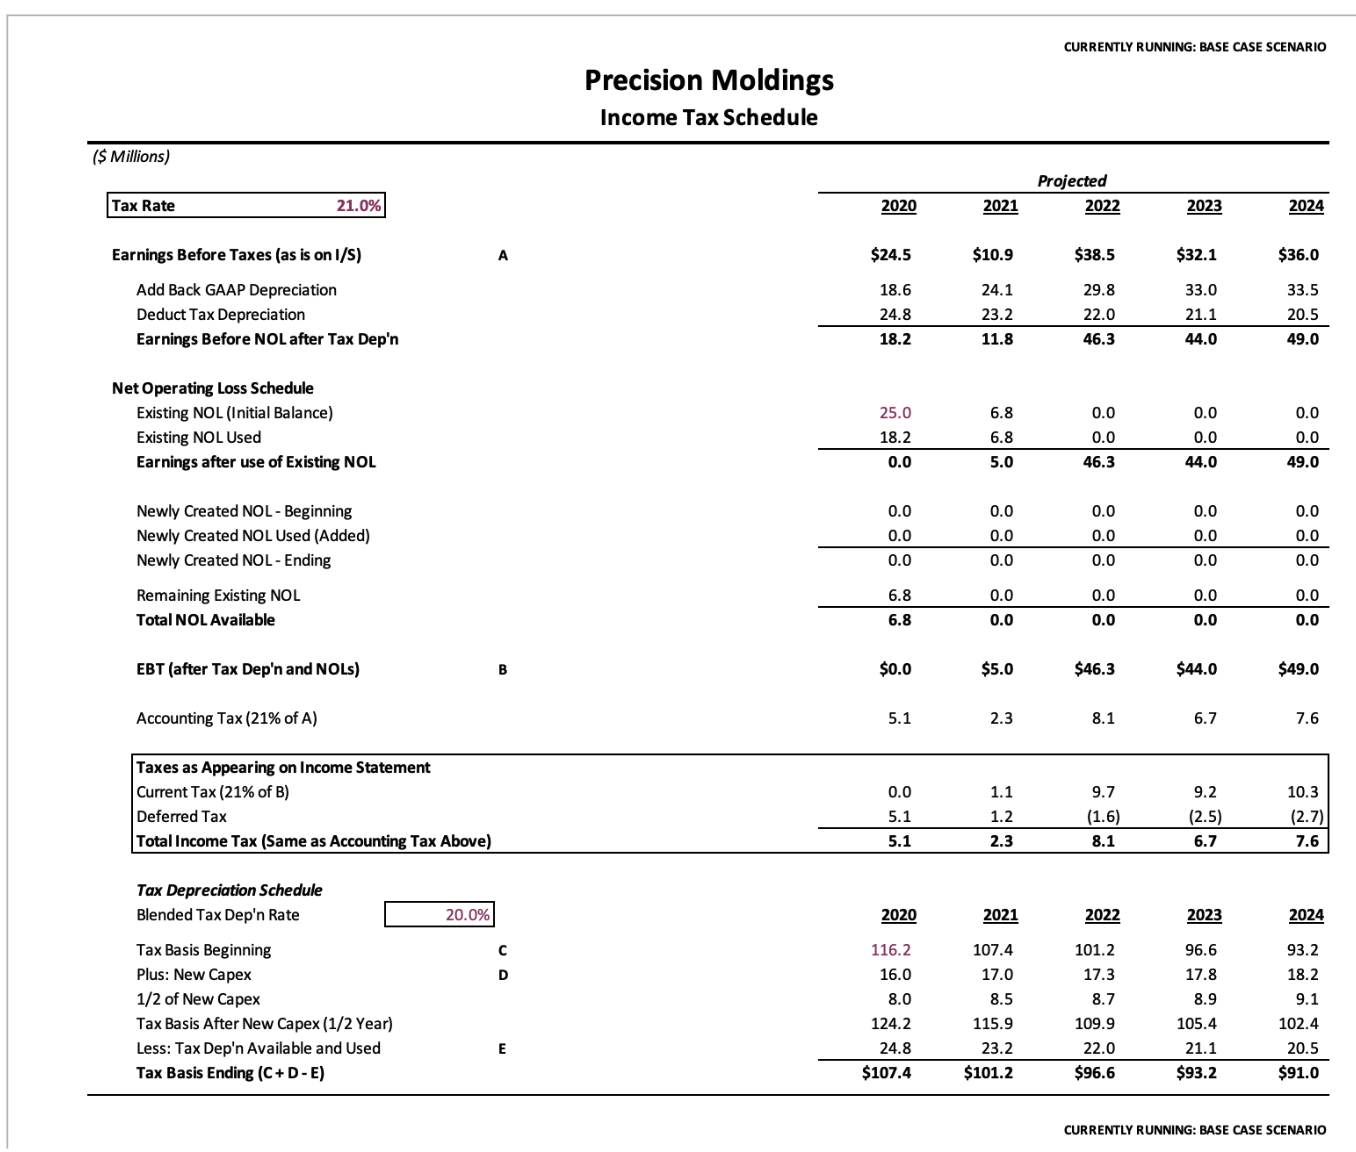
- Make your workbook look like statements: If your worksheet is representing a financial statement, make them look like financial statements by adding titles, bold text for key lines (eg revenue, EBITDA), and borders when summing up numbers
Documentation
Clear documentation acts as a guide for users, and helps them understand how your model arrives at its conclusions. All aspects of your model should be thoroughly documented, including the source of data, the formulas used, and any assumptions made.
Documentation should be easy to access and understand. Aggressively employ the comment tool and notes within your spreadsheet. Use comments to explain the logic behind specific formulas, to provide warnings or guidance about how certain cells should be used or not used, and to clarify any assumptions or sources of data. Notes can also be used to give additional context to data points or to highlight areas that require attention or review.
This practice is particularly valuable when the model is handed over to someone who wasn’t involved in its creation or when it’s revisited after some time.
Some general best practices for documentation:
- Use notes & comments: Create Excel notes in a separate column explaining all key assumptions. Use the Excel comment feature (Shift + F2) to notate important context
- Provide sources: Source all data, make sure to provide page numbers, year, etc. using a common sourcing syntax (eg 2023 AR Note 12 P73)
- Optional: Employ an additional column with rationale for assumptions (could also be in accompanying powerpoint or document)
Worksheet Organization
Effective worksheet organization is crucial for navigating and understanding financial models. Logical sequencing, clear sheet naming, and the strategic use of color coding can greatly enhance a model’s usability and ensure that users can easily access and interpret the necessary information.
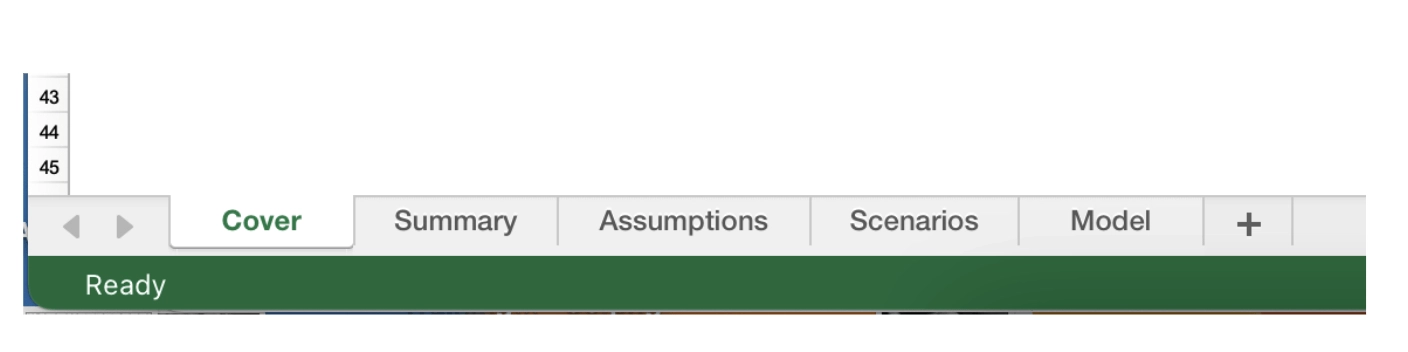
- Logical flow: Organize worksheets in a logical flow, typically starting with Cover, Summary, assumptions and inputs, followed by calculations (or scenarios), and your model
- Sheet naming: Use clear, descriptive names for each worksheet (e.g., “Assumptions”, “Income Statement”, “Balance Sheet”). Avoid using generic names like “Sheet1” or “Sheet2”.
- Tab colors: For larger models, consider using different colors for worksheet tabs to categorize sections (e.g., blue for inputs, green for outputs). This visual cue helps users navigate the model more easily.
Sections & Grouping and Outlining
Effective management of sections, grouping, and outlining is crucial for maintaining clarity and enhancing the usability of your financial models. Consistent use of headers, strategic merging of cells, and judicious application of Excel’s grouping and outlining features help organize the model’s content effectively. These practices not only improve the navigability of the model but also ensure that information is accessible and interpretable, facilitating a seamless user experience.
- Consistent headers: Use consistent and clear section headers within each worksheet to indicate different parts of the model (e.g., “Revenue Assumptions”, “Operating Costs”).
- Row and column grouping: Use Excel’s grouping feature to collapse and expand detailed sections of the model, making it easier to navigate while keeping the model clean and focused.
- Outlining: Create outlines to summarize detailed data. For example, group revenue streams to show a summary total.
Model Overview
- Introductory sheet: Consider starting the model with an overview or introduction sheet that explains the purpose of the model, key sections, and instructions for use. This sets the stage for users.
- Table of contents: Include a table of contents with hyperlinks to major sections or sheets within the model. This improves navigation, especially for complex models.
- Standardized layouts: If you’re working within an organization or team, use standardized layouts and templates for models. This ensures consistency across different models and reduces the learning curve for new users.
- Uniform financial statements: For models that include financial statements (e.g., income statement, balance sheet, cash flow statement), ensure that these are consistently formatted across different models.
Outputs and Summary Tables
- Key outputs sheet: Dedicate a worksheet to summarizing key outputs and metrics. This sheet should present the most important results of the model in a clear and concise manner.
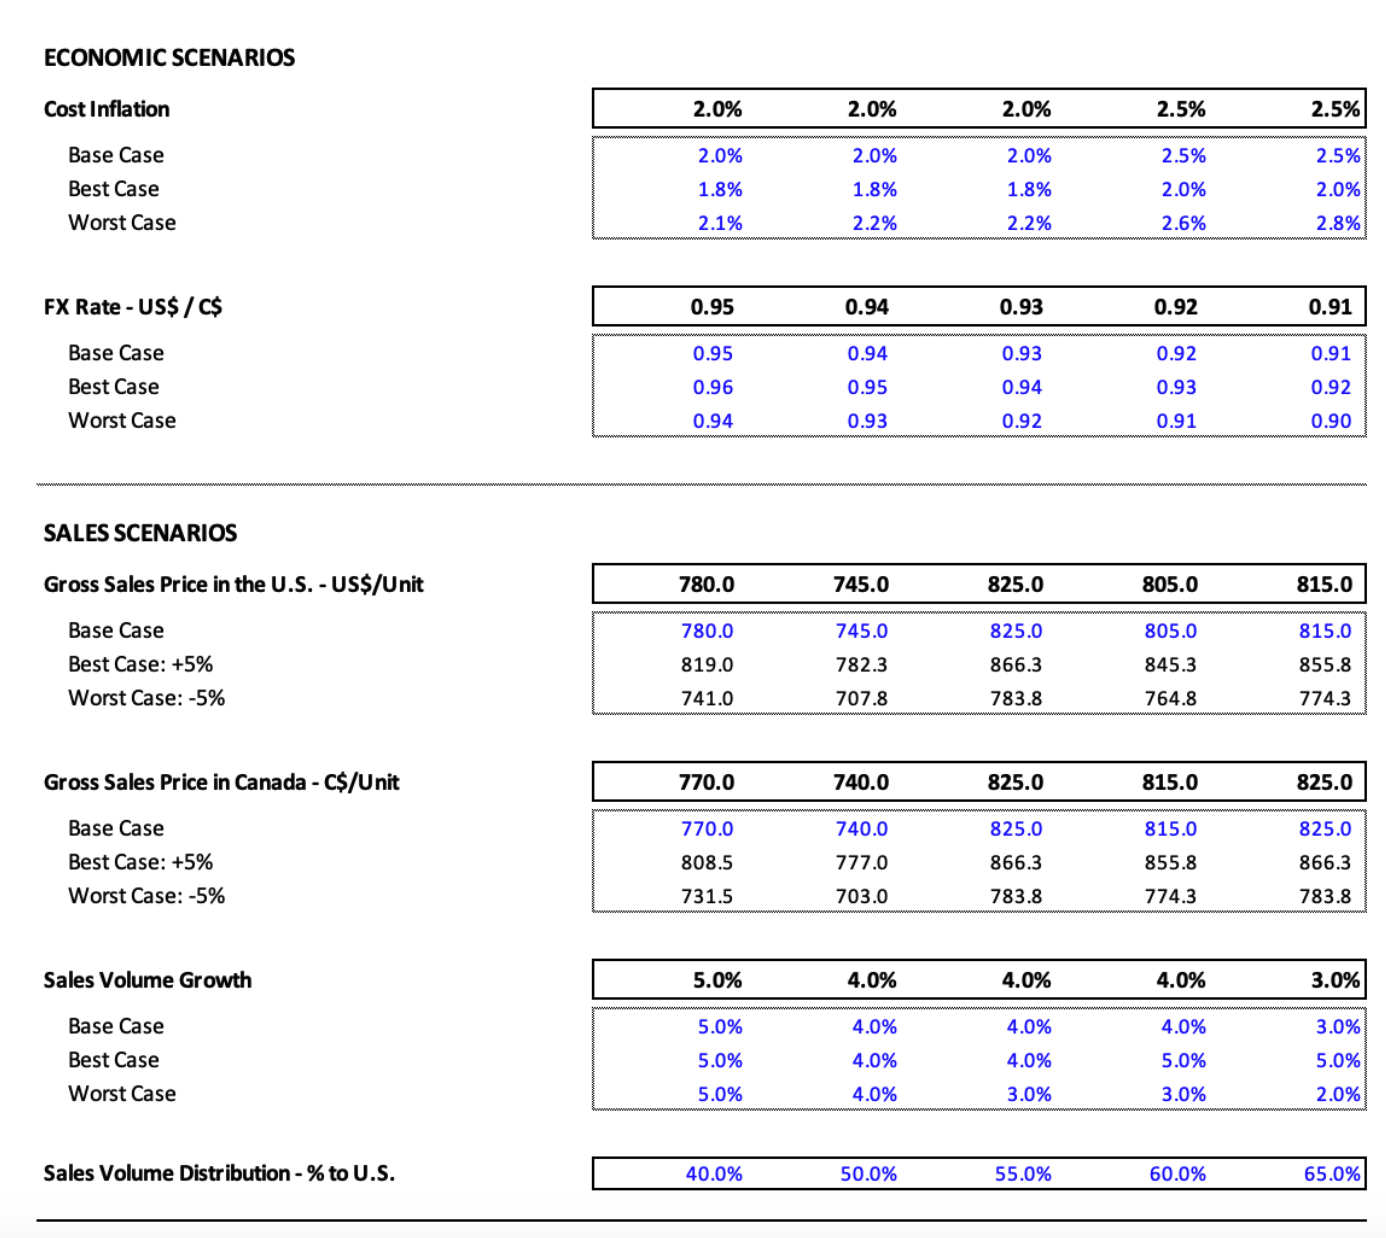
Scenario Analysis and Sensitivity Tables
- Scenarios: Include a clear section for scenario analysis, where different assumptions can be toggled to see their impact on outputs. Use data tables or drop-down menus to allow easy switching between scenarios.
- Sensitivity analysis: Provide sensitivity analysis tables that show how changes in key variables (e.g., interest rates, growth rates) affect the model’s outputs. These should be clearly labeled and easy to interpret.
Presentation and Printing Considerations
- Print layouts: Ensure that key sections of the model are formatted for printing if needed. Set appropriate print areas, include headers and footers, and ensure that pages are formatted to fit within standard print sizes (e.g., A4 or letter).
- Page layouts: Consider the use of landscape or portrait orientation for different worksheets based on content. For instance, summary tables may be better presented in landscape format for readability.
Conclusion
As we conclude our discussion on formatting within financial models in this second installment, we recognize how each formatting element, from color coding to worksheet organization, serves to minimize visual friction and enhance the usability of our models.
As we move forward, our focus will shift from the visual aspects of financial modeling to the underlying mechanics that drive them. The next article in our series will delve into best practices for developing formulas within our models. We’ll explore how to structure and write formulas that not only perform efficiently but are also transparent and easy to audit. This next step is crucial, as a well-formulated model reinforces the integrity of the analysis, ensuring that our models are not just visually appealing but are robust tools for informed decision-making.