While Excel and PowerPoint remain the indispensable tools of the finance professional’s toolkit, it’s clear the landscape of the Finance industry is rapidly evolving.
Data volumes are growing; speed is increasingly becoming the key factor in firm’s financial success; and decision-making is becoming more and more ubiquitous with the field of data science.
At Training The Street, we’re seeing this trend firsthand: our clients are demanding data science skills (particularly for data analysis and visualization) from their grads — and although there are many valid programming languages and packages, it is clear that Python is emerging as the language of choice for Finance.
In this article we’d like to cover seven of the most common use cases of how python is used in finance, and where we are seeing our client’s use Python:
The most common use case for Python in the finance industry is data analysis- working with (sourcing, organizing, cleaning, sorting) and interpreting (analyzing, filtering, structuring) large volumes of data for the purpose of analysis and reporting.
This is where most student’s journey’s with Python begin, as data analysis is the foundation of nearly all use cases for Python in Finance.
Activities within Data Analysis might include things like:

Data Gathering

Data Cleaning
Packages like pandas allows users to take messy data and clean and organize it into usable formats.
Data Manipulation
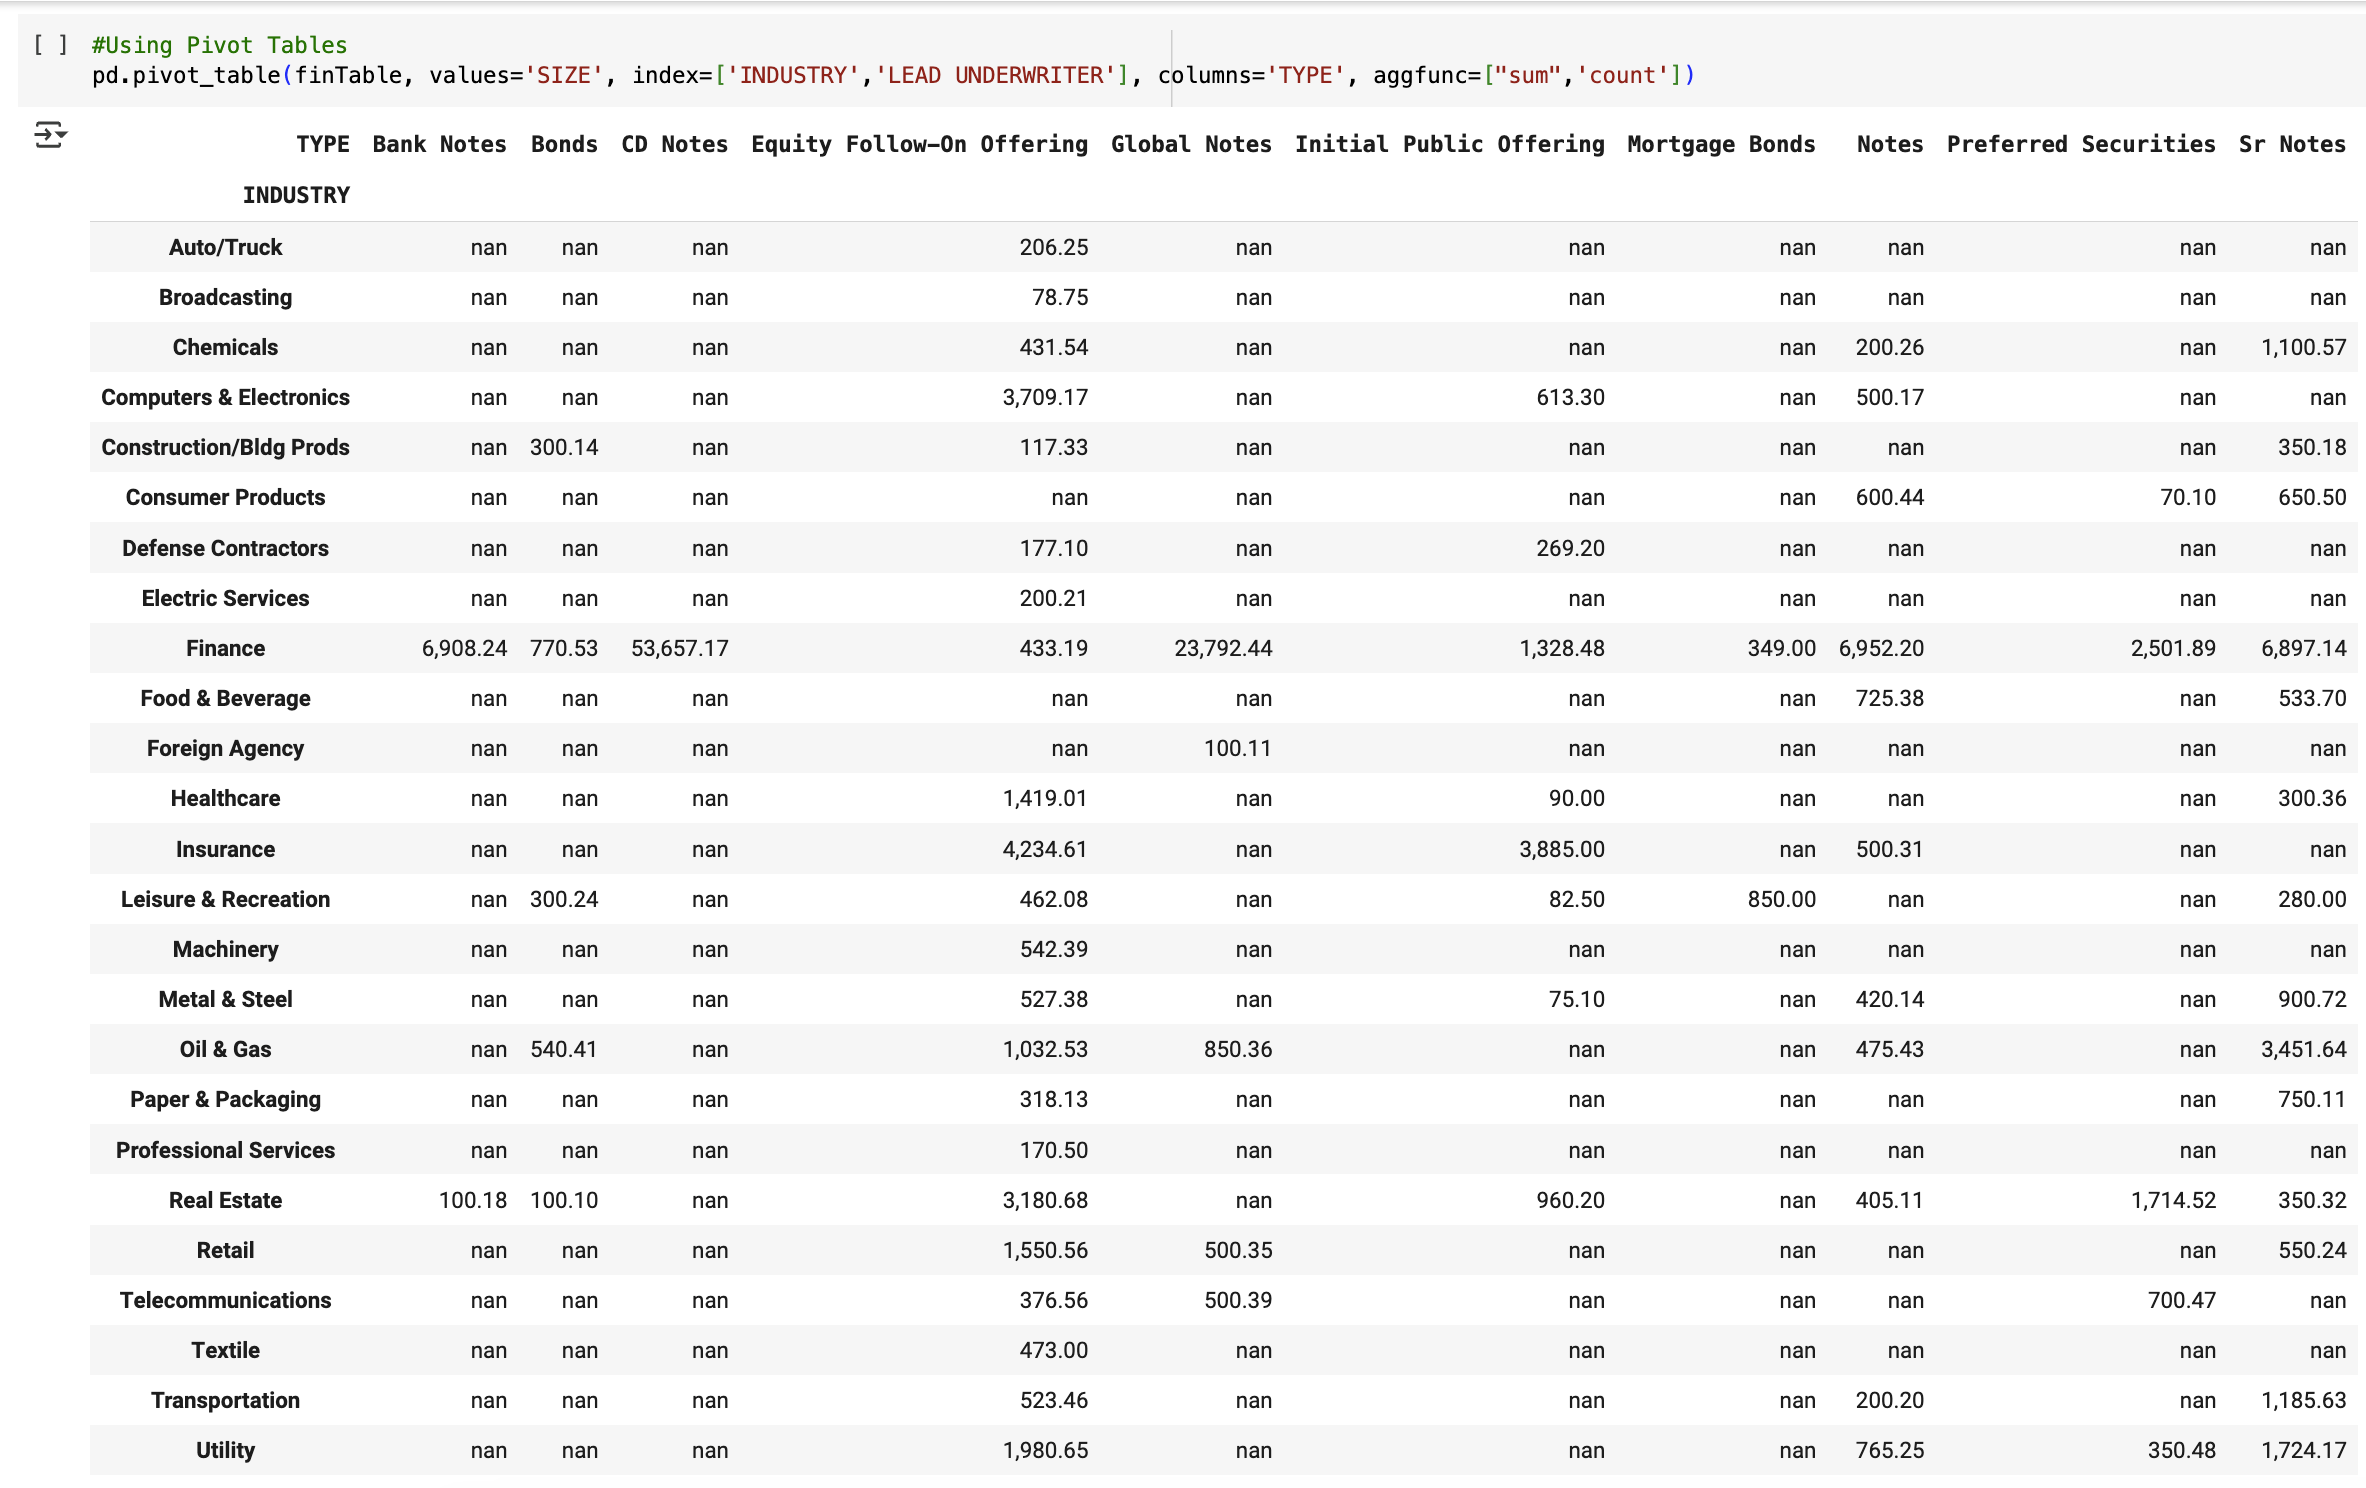
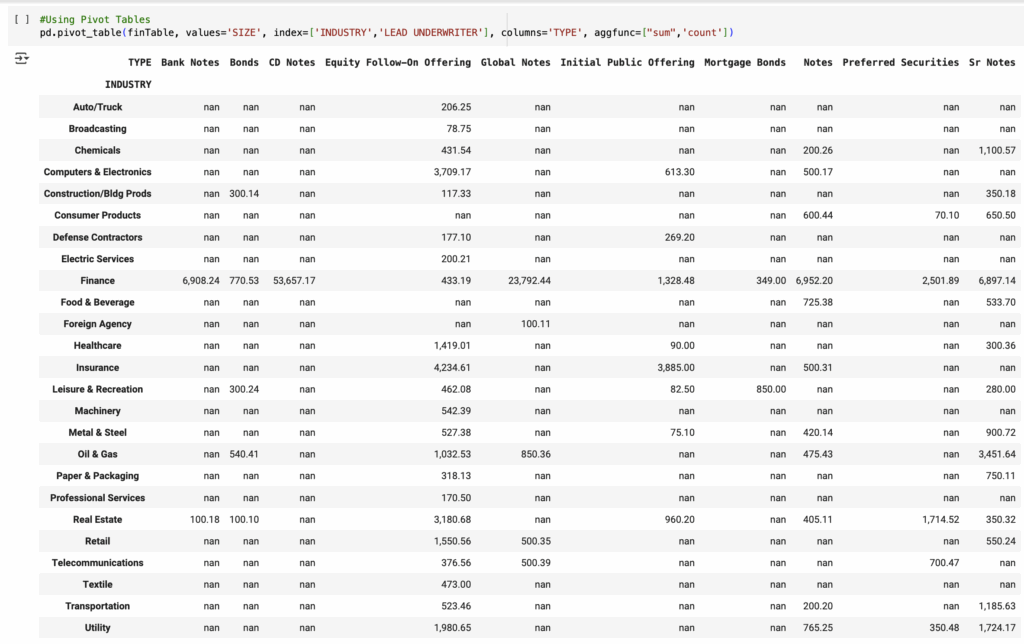
Once organized, there are many tools for analyzing and reporting on data, including summarizing data, adding custom formulas, sorting, filtering, and pivot tables.
The most common tools and libraries for Financial Data Analysis are: Python’s Anaconda library, Jupyter notebook and packages Pandas and NumPy.

Website: https://www.anaconda.com Documentation: https://www.anaconda.com/docs/main
Anaconda is a Python distribution designed for data science and analysis. It comes bundled with hundreds of essential packages—like NumPy, pandas, matplotlib, and scikit-learn—and includes powerful tools like Jupyter Notebook and Spyder IDE. Anaconda simplifies environment setup, especially for professionals working with large datasets and statistical models. With a single install, you get everything needed to run Python code for financial analysis, machine learning, and visualization—without worrying about dependency conflicts.
Website: https://jupyter.org/ Documentation: https://jupyter-notebook.readthedocs.io/en/latest/
Jupyter Notebook is an interactive coding environment that allows you to combine code, visualizations, and narrative text in a single document. Jupyter is ideal for exploratory analysis and model building. Analysts can test investment strategies, visualize trends, and document logic all in one place—making it a go-to tool for data-driven reporting, rapid prototyping, and audit-ready workflow documentation.
Website: https://pandas.pydata.org/
Documentation: https://pandas.pydata.org/docs/
Cheat sheet: https://pandas.pydata.org/Pandas_Cheat_Sheet.pdf
Pandas is Python’s premier library for working with structured financial data. It provides powerful data structures—Series and DataFrames—for cleaning, analyzing, and manipulating tabular and time series data. Whether you’re importing data from Excel, CSVs, APIs, or SQL databases, pandas allows you to clean, reshape, merge, and analyze datasets efficiently. Its built-in capabilities for handling missing data, creating calculated fields, performing group summaries, and applying rolling or time-aware calculations make it indispensable for tasks like calculating returns, aggregating trades, generating moving averages, or building sector-based pivot tables.
NumPy is a fast, low-level library for numerical computing in Python, and underpins most scientific and data libraries (including pandas). It’s a library that provides a powerful set of mathematical and statistical functions that enables a wide variety of array and matrix operations, through storing and manipulating data in NumPy arrays (multi-dimensional arrays that are similar to matrices in MATLAB). NumPy allows analysts to perform high-speed vectorized calculations essential to a number of use cases in Finance (portfolio optimization, risk modeling, and return simulations to name a few).
Python has become a foundational tool across the financial industry for sourcing, cleaning, and transforming data at scale. Below are some of the most common and practical ways data analysts and financial professionals apply Python in real-world scenarios.
Tools:
pandas,requests,sqlalchemy,PyPDF2,openpyxl,pandas.read_sql,requests, APIs
| Activity | Use Cases by Sector |
|---|---|
| Importing data from XLS/CSVs | FP&A: Budget templates, revenue models Equity Research: Historical stock data exports Private Equity: Portfolio company financials |
| Importing from SQL databases | Asset Management: Pulling fund performance data Global Markets: Order book data and execution logs |
| Extracting data from PDFs | Investment Banking: Parsing CIMs (Confidential Information Memos), pitch decks Private Equity: Scraping financials from filings |
| Retrieving data from web APIs | Global Markets / Hedge Funds: Live quotes, FX rates, economic indicators Equity Research: Real-time news, earnings data from APIs like IEX Cloud or FRED |
Tools:
pandas,numpy,re(regex),dateutil
| Activity | Use Cases by Sector |
|---|---|
| Handle missing values, drop unnecessary rows/cols | FP&A: Monthly model refresh Asset Management: Cleaning NAV or holdings data |
| Combining multiple files | Investment Banking: Combining comps or precedent deal databases Private Equity: Roll-up of portfolio financials |
| Regex/text cleanup (tickers, CUSIPs) | Bond Market: Clean security identifiers Equity Research: Ticker standardization across sources |
| Normalize columns, rename headers, fix types | Global Markets: Normalize tick-by-tick feeds FP&A: Align business unit reporting formats |
| Forward-fill/back-fill time gaps | Asset Management: Time series gap-filling for return analysis Equity Research: Estimating missing earnings periods |
Tools:
pandas,numpy,groupby,pivot,merge,resample,rolling, etc.
| Activity | Use Cases by Sector |
|---|---|
| Summarizing and aggregating data | FP&A: Revenue by product line PE: EBITDA roll-ups Equity Research: Earnings summaries |
| Pivot tables | Investment Banking: League table creation Asset Management: Sector allocation breakdowns |
| Rolling/expanding windows | Global Markets: Calculate volatility, moving averages Hedge Funds: Statistical arbitrage |
| Group by categories (sector, issuer) | Equity Research: Peer benchmarking Bond Market: Grouping by issuer or maturity |
| Reshaping data (melt, stack) | FP&A: Monthly actuals vs forecast reshaping Investment Banking: Deal pipeline reformatting |
| Merge/join datasets | PE: Match operational KPIs to financial metrics Hedge Funds: Combine pricing feeds with trade data |
| Time-based indexing/resampling | Asset Management: Resample daily returns to monthly Global Markets: Aggregate tick data to hourly bars |
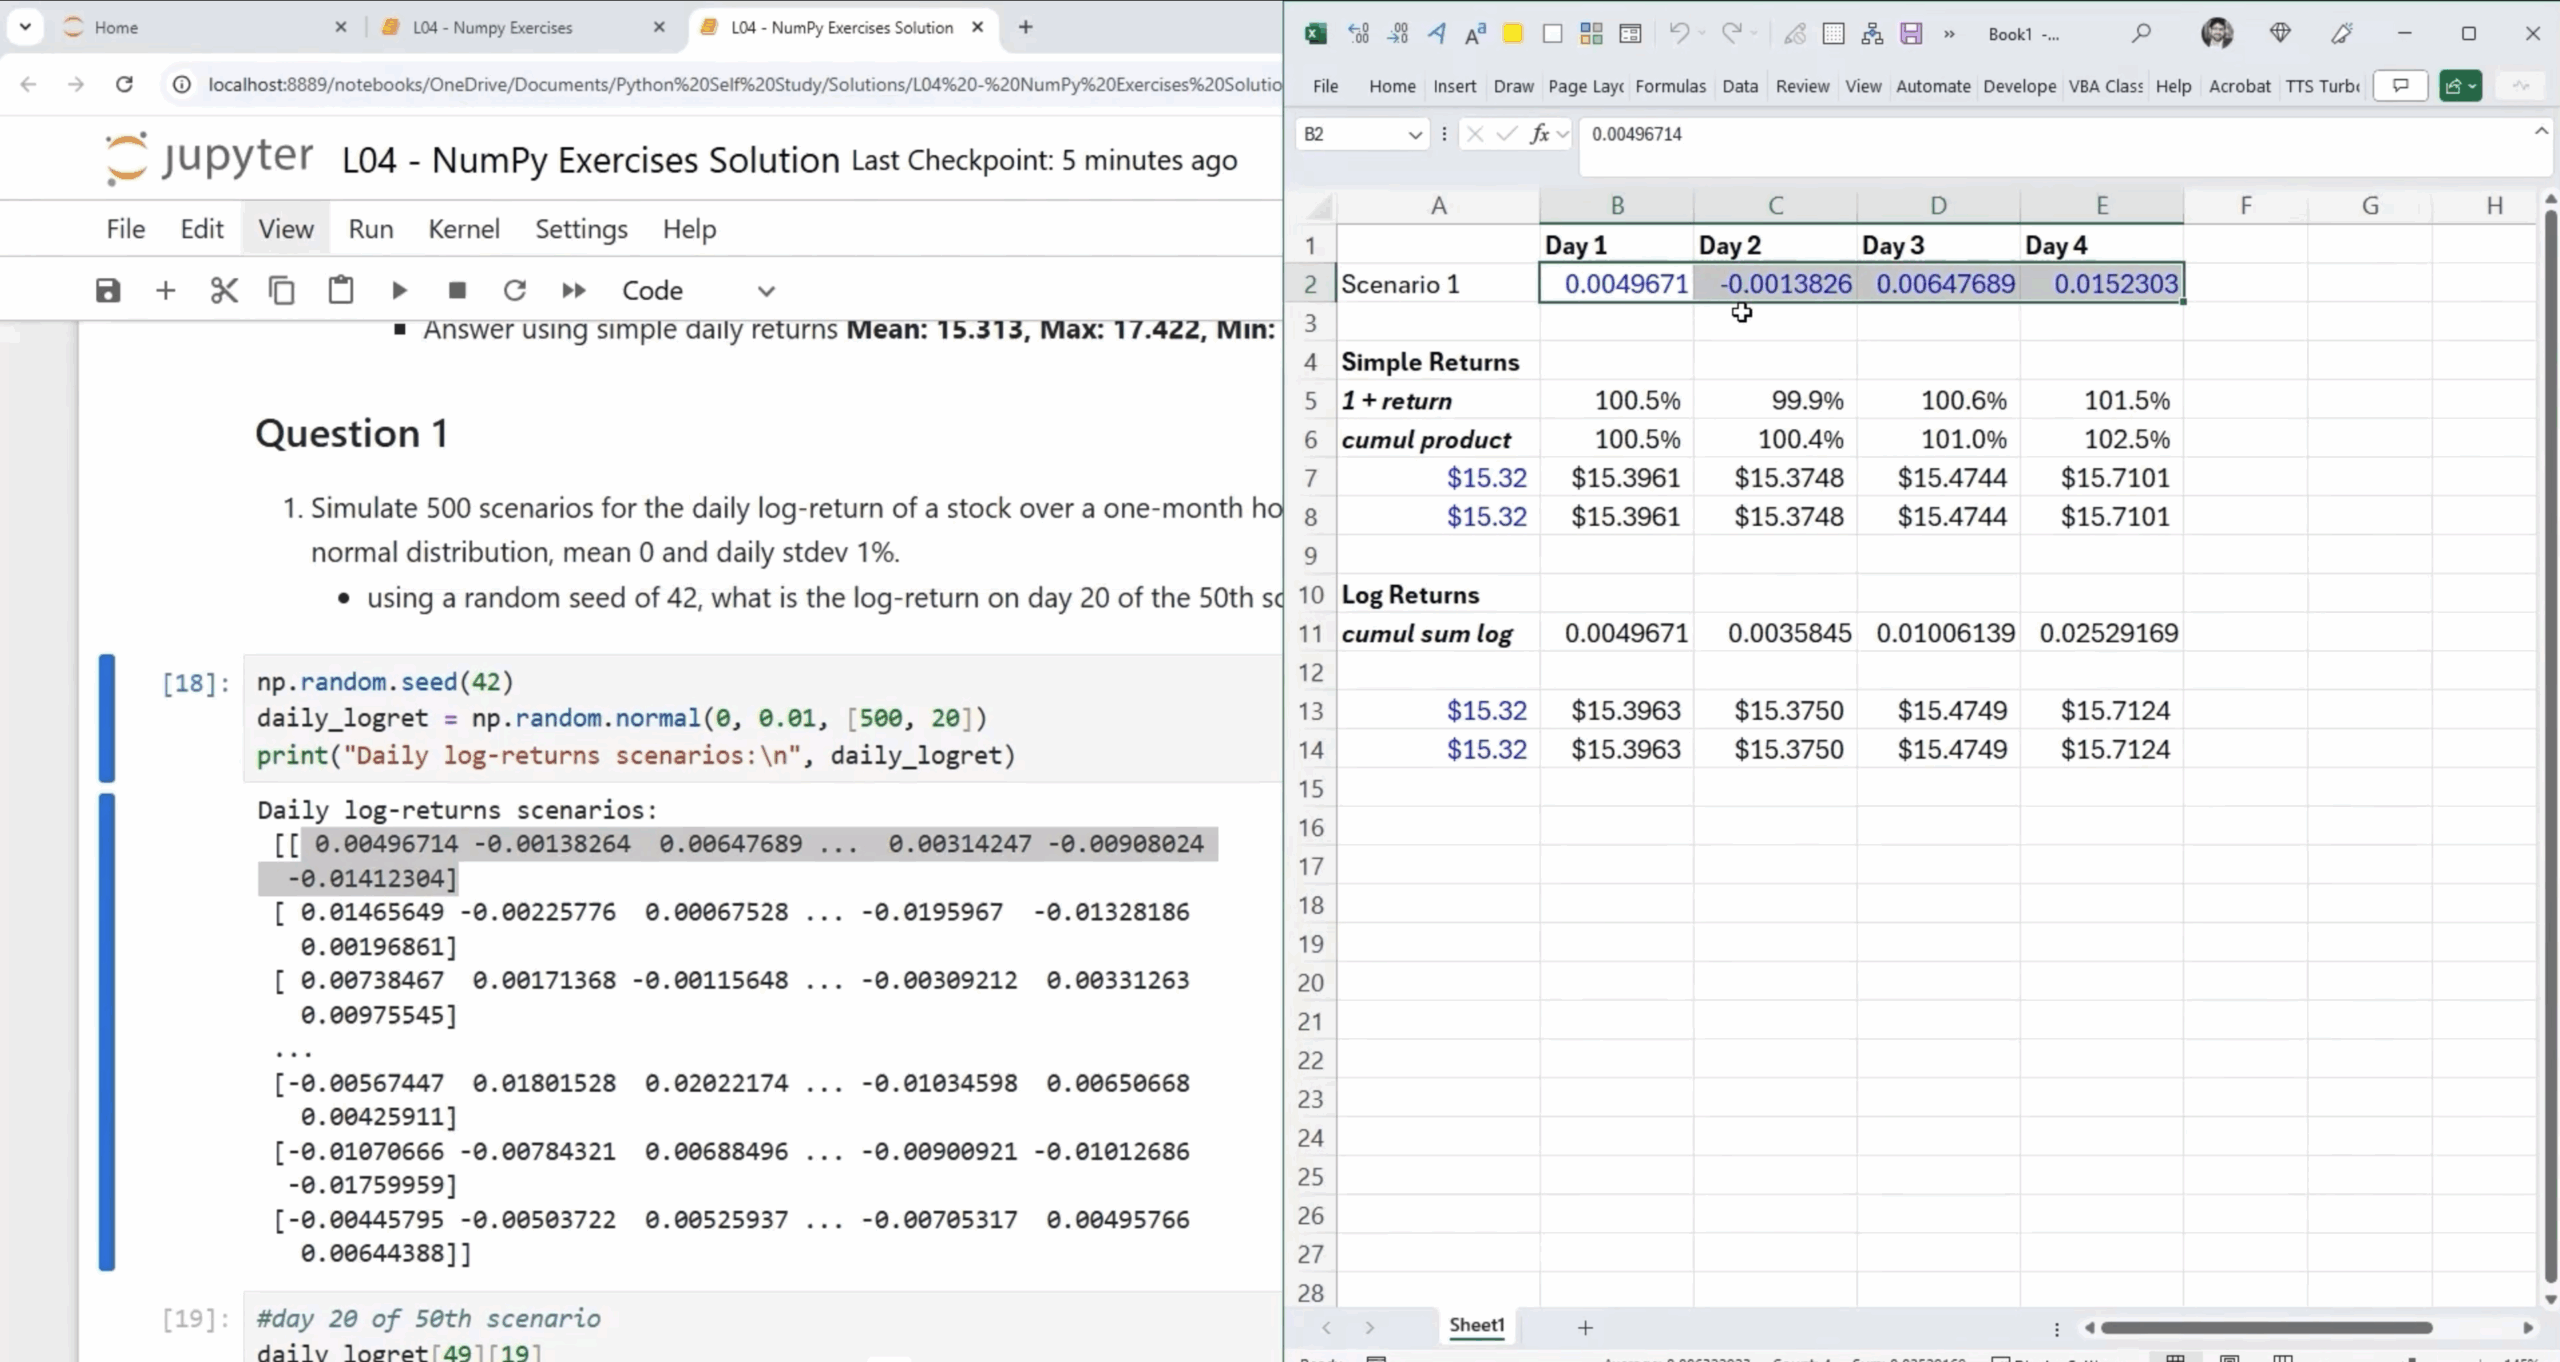
| Vectorized math (e.g., log returns) | Hedge Funds: Performance attribution Equity Research: Factor models FP&A: CAGR, margin analysis |
Understanding concepts like data gathering, cleaning, and manipulation is one thing—but what does Python look like in practice? What does the code actually do, and what kind of output can analysts expect?
In this section, we walk through three real-world examples that demonstrate how Python—specifically libraries like pandas and numpy—is applied in finance to solve common problems. From working with trade data to running simulations and building summary reports, these examples showcase Python’s versatility and impact in daily financial workflows.
Example 1: Importing Merging, and Filtering Trades Data
In our first example, one of our Python 1:Core Data Analysis instructors Bogdan Tudose, walks through some of the most common data analysis activities in Finance: Importing and exploring Excel data into Python, merging data from multiple tables with similar structure, merging data from different tables with different structures but common columns, and filtering data with advanced boolean logic.
Example 2 – Using Pandas to perform common Financial Analysis on a Dataset
Pandas Demo: https://bitly.com/MqPandas
In this demo, we walk through a complete workflow for analyzing financial data using Python, showcasing the power of the Pandas library along with Matplotlib and Seaborn for visualization.
Starting with importing data from an Excel file, the demo covers essential data preparation steps including cleaning missing values, converting data types, and formatting columns. It then moves into exploratory analysis with visual tools such as count plots, histograms, and boxplots to understand distributions and category breakdowns. The demo also illustrates how to create calculated fields, apply filters to extract specific subsets of data, and perform groupings and pivot table summaries—mimicking Excel’s functionality but with more control and automation. Finally, it shows how to export the results back to Excel, completing a typical end-to-end data analysis process.
Example 3 – Private Equity – Using Pandas to Work with Trading Data
[Video Coming Soon]
This demo shows a simple example of how pandas can be used to merge client trade data, with data pulled from the S&P500 data so that the tickers, GICS sectors are included in the final dataframe.
One of the core features of Pandas, is the ability to import and source financial data in a format that can be worked with by code. Pandas offers off the shelf ways to importing data from Excel, CSV files, PDFs, SQL databases, and more.
For those interested in learning Python for Data Analysis, we recommend familiarizing yourself with the following key areas that are particularly impactful:
1. Familiarize yourself with Python’s Logic/Data Structures
Develop a solid understanding of data types, loops, functions, and control flow to build a strong coding foundation.
2. Learn to use NumPy and Pandas effectively
Learn to manipulate and analyze structured data. Learn about arrays, DataFrames, and time series data.
3. Learn how to find, import, and sort financial datasets
Learn how to process and format raw financial data—such as earnings reports or transaction logs in Pandas and NumPy.
4. Learn to Clean, slice, and merge financial datasets
Practice with less than ideal data and practice transforming it into analysis-ready formats. Learn to combine files, remove rows and columns, handle missing values, correct data types, and split merged columns.
Apply your skills to tasks like calculating financial metrics, summarizing trends, and automating reporting. Get comfortable with creating pivot tables, sorting vales, and applying custom functions and calculations to data in your dataframes.
6. Practice Implementing Repeatable Workflows in your daily worklife
Try to use Python to develop a solution to one of your regularly recurring tasks that has to do with handeling data; such as monthly reporting, performance tracking, or model refreshes.
Interactable Demos and Other Python Resources from Training the Street
Live Pandas Demo – Investment Banking
A demo by our own Bogdan Tudose that shows a step-by-step example of how python can be used to process and format raw financial data—in this case on raised capital. From importing a CSV dataset, through organize, filtering, and sorting issuances by transaction size, underwriter and industry.
https://colab.research.google.com/drive/16DSG1xGxoyIpQaJWjAg39NqWsBahIrxZ
Learn the essentials of Python programming and data analysis to build a strong foundation for handling real-world data challenges in finance:
Visualization is the bridge between raw data and actionable decision-making. Python equips finance professionals with a flexible and powerful suite of tools for turning complex datasets into compelling visuals. From quick exploratory charts to full-fledged interactive dashboards, Python’s visualization libraries offers it all.
Common data visualization activities might include:
Trend & Time-Series Visuals
Track changes in financial metrics over time.
Comparative & Categorical Visuals
Compare values across companies, sectors, or categories.
Statistical & Correlation Visuals
Explore relationships and patterns in data.
Scatter plots for risk-return and factor analysis
Heatmaps of correlation matrices between assets
Regression and trendline plots (with confidence intervals)
Pair plots for multi-variable exploration
The most common libraries for Data Visualization are: Pandas, Matplotlib, Seaborn, and Plotly.
Website: https://pandas.pydata.org/ Documentation: https://pandas.pydata.org/docs/ Cheat sheet: https://pandas.pydata.org/Pandas_Cheat_Sheet.pdf
While pandas is primarily a data manipulation library, it also includes built-in visualization features that make it easy to generate quick line charts, histograms, and bar plots directly from DataFrames. Pandas makes it simple to go from raw numbers to visual insights in one line of code. For time series like stock prices, returns, or revenue trends, analysts can use .plot() methods to generate instant visuals without leaving the pandas workflow—perfect for quick checks, exploratory analysis, or iterative model debugging.
Website: https://matplotlib.org/ Examples Gallery: https://matplotlib.org/stable/gallery/index.html Documentation: https://matplotlib.org/stable/contents.html
Matplotlib is Python’s foundational plotting library, giving you full control over static chart design—everything from line graphs to complex subplot grids. Matplotlib is a powerful 2D and 3D visualization package modeled after MATLAB’s plotting system. It provides full control over every chart element for static, publication-quality graphics. Matplotlib excels at visualizing both time-series and cross-sectional financial data, making it perfect for tracking stock performance, building multi-asset dashboards, or plotting economic indicators. From subplot grids to annotated charts, it’s the foundational tool for creating precise, highly customized visuals.
Website: https://seaborn.pydata.org/ Examples Gallery: https://seaborn.pydata.org/examples/index.html Documentation: https://seaborn.pydata.org/tutorial.html
Seaborn builds on Matplotlib by providing pre-configured, aesthetically pleasing statistical charts with minimal code. Seaborn is perfect for quick visual exploration of financial datasets. With just a few lines of code, you can generate heatmaps, box plots, pair plots, and regression lines—ideal for analyzing sector correlations, return distributions, or outliers in company fundamentals. It’s especially useful when you want visually rich insights without the overhead of complex chart formatting.
Website: https://plotly.com/
Examples Gallery: https://plotly.com/python/
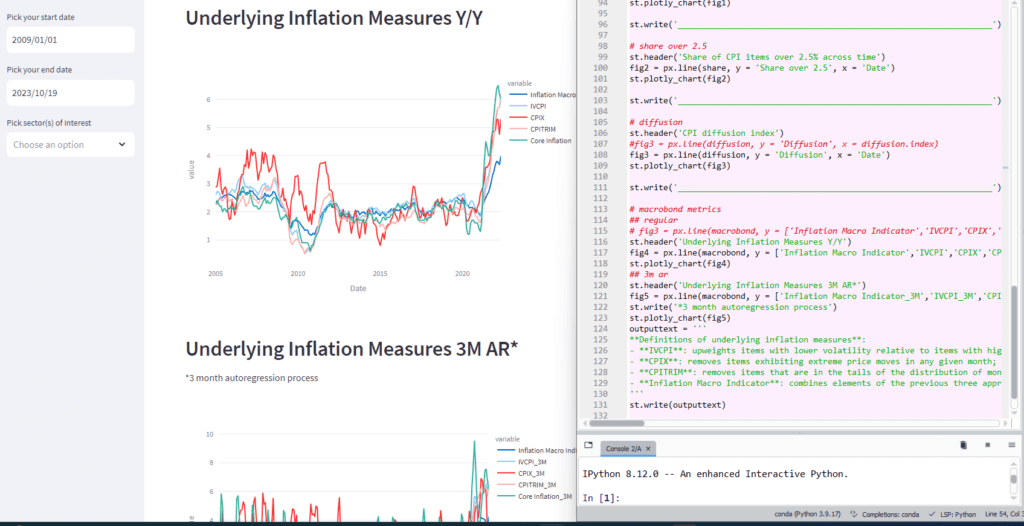
Plotly enables the creation of interactive, web-ready charts with rich user engagement features like hover tools, zooming, and dropdown filters. Plotly is the best option when you need to present financial data dynamically—think dashboards that allow stakeholders to filter by asset class, time range, or risk profile. It’s widely used for executive dashboards, fintech product UIs, and client-facing investment reports where static charts don’t tell the whole story. It’s interactive plotting library supports more than 40 charts. Plus, integration with tools like Dash and Streamlit lets you build full-fledged data apps.
Whether exploring trends in financial markets, comparing metrics across portfolios, or analyzing correlations in large datasets, Python offers a flexible suite of tools to visualize financial data clearly and effectively.
The examples below highlight common visualization types and their real-world applications across sectors such as Investment Banking, Private Equity, Equity Research, Asset Management, Hedge Funds, the Bond Market, and FP&A.
Tools:
matplotlib,seaborn,plotly,pandas.plot(),rolling()
| Visualization Type | Description | Sector Use Cases |
|---|---|---|
| Line charts | Plot trends over time (prices, KPIs, ratios) | Equity Research: Stock performance since earnings Asset Mgmt: NAV over time FP&A: Monthly revenue/margin trends |
| Moving averages / rolling windows | Smooth volatility or trendlines | Hedge Funds: SMA/EMA for trade signals PE: Rolling EBITDA margins Equity Research: Rolling EPS growth |
| Dual-axis charts | Overlay two metrics with different scales | IB: Revenue vs underwriting fees FP&A: CapEx vs Operating Margin AM: Performance vs benchmark |
| Area plots | Show cumulative totals or proportions | IB: Aggregate capital raised AM: AUM growth by strategy Bond Mkt: Issuance volume by maturity |
Tools:
seaborn.barplot,sns.boxplot,matplotlib,plotly.express,pandas.value_counts().plot()
| Visualization Type | Description | Sector Use Cases |
|---|---|---|
| Bar / column charts | Compare categories (companies, funds, sectors) | IB: Top deals by firm PE: Portfolio returns by company FP&A: Cost centers by spend |
| Stacked/grouped bar charts | Multi-dimensional comparisons | Equity Research: Revenue by business unit AM: Sector exposures across funds Bond Mkt: Bond issuance by rating and currency |
| Box plots / violin plots | Analyze distributions (returns, ratios) | Hedge Funds: Return distributions by strategy Equity Research: P/E spread across sectors PE: Valuation ranges across deals |
| Swarm / strip plots | Display raw data points | Equity Research: Analyst targets for a stock AM: Fund fees across providers IB: Deal sizes in a niche sector |
Tools:
seaborn.heatmap,sns.pairplot,sns.regplot,plotly,matplotlib
| Visualization Type | Description | Sector Use Cases |
|---|---|---|
| Scatter plots | Show relationships between variables | Equity Research: ROE vs P/BV Hedge Funds: Risk vs return FP&A: Cost vs headcount |
| Heatmaps | Display matrix data visually | AM: Correlation matrix of asset returns Equity Research: Sector correlation matrix Bond Mkt: Duration vs credit risk matrix |
| Regression/trendline plots | Show predicted relationships, confidence | PE: Valuation vs revenue growth Equity Research: EPS vs stock price FP&A: Revenue vs marketing spend |
| Pair plots | Multivariate relationship mapping | Hedge Funds: Factor analysis across tickers AM: Factor exposure view PE: KPI cluster analysis across investments |
Python’s plotting libraries, such as Matplotlib and Seaborn, allow analysts to turn raw data into visual insights. With a few commands, you can plot a stock’s price history, visualize trading volumes, or create a bar chart of a portfolio’s asset allocation. These libraries are highly customizable, enabling finance teams to produce publication-quality visuals for reports.
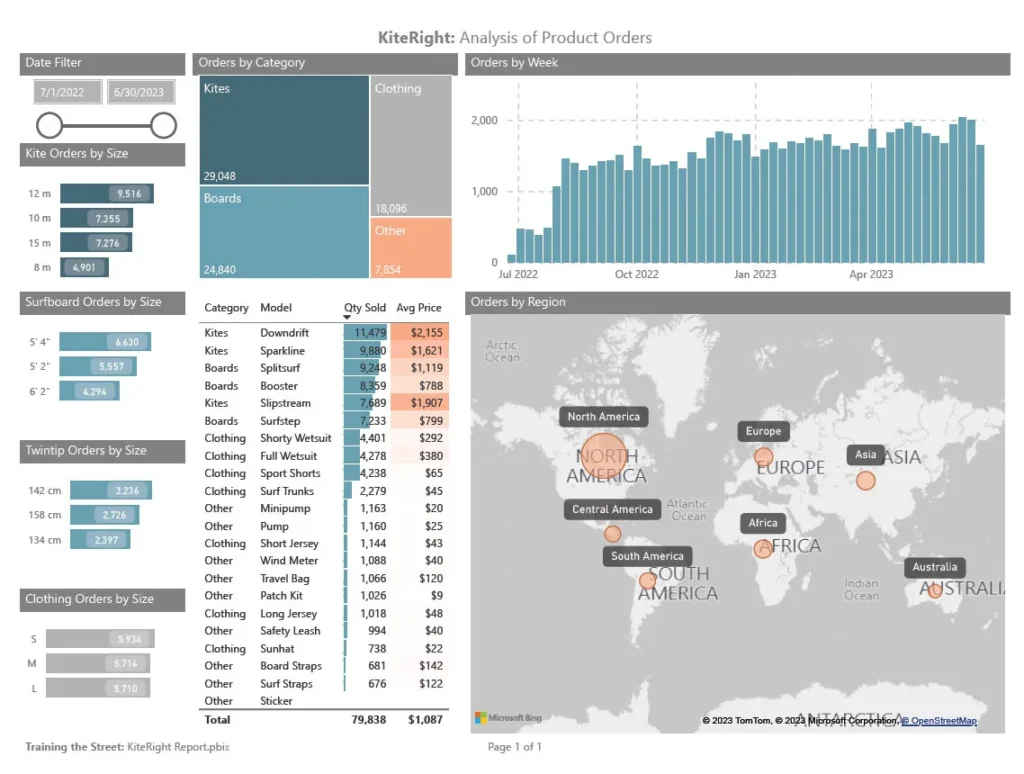
Example 1: Grouping and Visualizing Client Trade Data
Charting Quarterly Earnings
For example, an investment analyst might use Python to generate a line chart of a company’s quarterly earnings over several years, complete with trend lines and annotations, to include in a client presentation.
Asset/Portfolio Heatmaps
Whether it’s an investment committee presentation or a client-facing research report, the narrative often revolves around charts and visuals. Python helps create compelling visual stories from complex data. For instance, a strategist could use Python to produce a heatmap of correlations between different asset classes to discuss diversification benefits, or generate an interactive graph of scenario outcomes for an economic forecast. By visualizing data effectively, analysts ensure that the key messages (e.g., “our model predicts a range of outcomes, mostly clustered around 5-7% returns”) are understood at a glance.
Develop the ability to use Python’s two core plotting libraries—Matplotlib and Seaborn—to generate professional-quality charts and graphs that reveal financial insights.
Understand how to visualize trends and relationships in financial data using time series plots (e.g., stock prices) and scatter plots (e.g., risk vs. return) to draw meaningful conclusions.
Learn to adjust titles, labels, colors, grids, and legends to improve clarity and aesthetics in your plots. Discover how to create subplot layouts and annotate charts for reports or presentations.
Visualize data distributions, volatility, and outliers using histograms, box plots, and other statistical charts that are especially useful for comparing financial metrics across categories.
Use Plotly to create dynamic, interactive visualizations—like dashboards and drill-down charts—that can be exported as standalone HTML files or shared online with stakeholders.
Skills in data visualization are essential for anyone working with financial data. The ability to transform complex datasets into clear, compelling visuals is what allows analysts, portfolio managers, and decision-makers to spot trends, identify risks, and communicate findings with impact.
The techniques learned here—plotting time series, comparing financial metrics, and mapping relationships between variables—are not just useful for reports or presentations. They form the visual layer that connects data analysis to real-world financial decisions. Whether you’re preparing client materials, building dashboards, or validating models, visualization is what brings your analysis to life.
For those looking to develop strong data visualization skills in Python, we highly recommend our Python 2 Course: Data Visualization for Finance.
Learn the essentials of Python programming and data analysis to build a strong foundation for handling real-world data challenges.
After mastering the fundamentals of data analysis and visualization, the next step is bringing those insights to life through dashboards—interactive, dynamic tools that allow users to monitor, explore, and report on financial data in real time. Dashboarding sits at the intersection of automation, data storytelling, and user interface design, making it one of the most impactful applications of Python in finance today.
Dashboards allow analysts and decision-makers to interact with data through filters, sliders, and dropdowns, enabling them to explore trends, compare scenarios, and generate reports—all without writing a single line of code. Whether it’s automating performance reporting, tracking market trends, or visualizing KPIs across departments, dashboards turn static charts into flexible, live tools.
Using packages like Dash and Streamlit, financial professionals can rapidly prototype and deploy web-based dashboards that connect to live data sources and provide rich, interactive visualizations. With Plotly, Bokeh, and Seaborn as visualization engines under the hood, these dashboards combine automation and aesthetics in a seamless experience.
Common data visualization activities might include:
Interactive Charting and Filtering
Let users explore financial data dynamically.
Dashboard Layout & Design
Structure dashboards like mini-analyst reports or terminals.
Real-world Deployment & Live data
Share dashboards via public link or host internally
Export filtered data or visual snapshots to CSV/PDF
Automate reports (e.g., daily update of pricing dashboard)
Use dashboards for earnings prep, portfolio tracking, or scenario analysis
The most common libraries for Data Dashboarding are: Bokeh, Seaborn, and Plotly.
Website: https://docs.bokeh.org/en/latest/index.html Examples Gallery: https://docs.bokeh.org/en/latest/docs/gallery.html
Bokeh is a powerful Python library for building highly interactive, browser-based financial dashboards. It’s especially suited for situations where users need to interact with visual elements—filtering data, adjusting inputs, or viewing live updates. Bokeh is excellent for creating real-time, data-driven interfaces for applications like portfolio monitoring, trading dashboards, or risk scenario explorers. It supports streaming data, sliders, dropdowns, and event callbacks, making it ideal for quant teams or analysts who want to build responsive tools without writing JavaScript. It’s generally considered more complex than Plotly express but more customizations can be made.
Website: https://seaborn.pydata.org/ Examples Gallery: https://seaborn.pydata.org/examples/index.html
Seaborn is a statistical visualization library that specializes in clean, concise, and highly informative static plots. While not a dashboarding tool on its own, Seaborn is often used within dashboards (built with Streamlit or Dash) to display key visuals like correlation heatmaps, distribution plots, or regression visuals. It’s especially effective for exploratory data analysis and communicating complex relationships between financial variables with minimal code.
Website: https://plotly.com/ Examples Gallery: https://plotly.com/examples/
Plotly is the leading Python library for interactive, web-friendly charts—and the backbone of Plotly Dash, a full framework for building analytical web apps in pure Python. Plotly is widely used for building modern, client-ready financial dashboards. It’s ideal for use cases like P&L trackers, interactive valuation models, and real-time KPI reports. Features like hover info, zooming, time filters, and multi-page navigation make it an excellent tool for executive reporting, portfolio analytics, and fintech applications.
As financial data sets grow more complex, and decisions more time-sensitive, professionals across the industry are turning to Python-powered dashboards to interpret, interact with, and deliver real-time insights.
Dashboards make it possible to move from static reports to dynamic, user-driven analysis—helping analysts, managers, and stakeholders monitor performance, track risk, and make informed decisions more efficiently.
Python provides a powerful ecosystem for dashboarding, combining interactive visualization libraries with web frameworks that allow analysts to build fully functional applications. These tools are increasingly used across Investment Banking, Private Equity, Equity Research, Asset Management, Hedge Funds, the Bond Market, and FP&A to build reporting environments that are not only interactive but also fully integrated into real-world workflows.
The sections below highlight common features and layouts of financial dashboards—along with real-world examples of how they’re used across different sectors.
Key Tools: Plotly, Bokeh, Dash (callbacks), Streamlit (widgets)
| Feature | Description | Use Cases by Sector |
|---|---|---|
| Hover details, zoom, tooltips | Allows users to view details on demand and focus on specific time periods or data points | Equity Research: Hover to view earnings per quarter Hedge Funds: Zoom into volatility spikes Bond Market: Tooltip on yield curve datapoints |
| Dynamic filters (time, asset, region, scenario) | Users can adjust the data view via dropdowns, sliders, or toggles | Asset Management: Filter performance by strategy or region FP&A: Filter budget data by department or time period Investment Banking: Filter deals by sector or transaction size |
| Drill-down navigation | Enables users to move from summary-level dashboards to specific records or metrics | Private Equity: View fund performance → portfolio company → operational KPIs Equity Research: Sector → Company → Model Investment Banking: Region → Deal Type → Client Summary |
| Linked visuals | Selecting a value in one chart updates related charts automatically | Asset Management: Select a fund to update allocation, return, and risk metrics FP&A: Toggle product line to see changes in revenue, margin, and cost breakdown |
Key Tools: Dash, Streamlit, Panel, Jupyter Voila
| Feature | Description | Use Cases by Sector |
|---|---|---|
| Arranged plots and controls | Combine multiple visualizations with filters and controls into a coherent layout | FP&A: Revenue and expense panels with filters by business unit Private Equity: KPI, valuation, IRR, and trend panels for each portfolio company |
| Sidebar filters, tabbed views | Enable users to quickly switch between datasets or dashboard pages | Investment Banking: Tabs for IPOs, M&A, ECM Global Markets: Tabs for macro, strategy, performance |
| KPI indicators and metrics | Use cards or tiles to highlight key metrics like IRR, Sharpe ratio, or margins | Private Equity: Display IRR, DPI, MOIC Asset Management: Highlight rolling returns, alpha FP&A: Monthly variance, profit margins, YoY change |
| Multi-page dashboards | Structure the dashboard into multiple linked pages or sections | Asset Management: Overview → Attribution → Risk Equity Research: Company Overview → Valuation → Scenario Models |
Key Tools: Streamlit Cloud, Dash Enterprise, Heroku, PDFKit, nbconvert
| Feature | Description | Use Cases by Sector |
|---|---|---|
| Share via URL or internal network | Host dashboards as web applications or internal portals | Investment Banking: Internal deal dashboards Asset Management: Fund dashboards for client reporting |
| Export filtered results | Allow users to download customized views as CSV or PDF for audit or reporting | FP&A: Save filtered financials Equity Research: Export forecast models or valuation tables |
| Automated refresh and reporting | Schedule automatic updates based on new data feeds or time triggers | Hedge Funds: Daily market dashboards FP&A: Weekly budget performance reports Bond Market: Real-time credit spread dashboards |
| Scenario analysis and reporting tools | Use dashboards to toggle between different model assumptions and metrics | Equity Research: Test valuation scenarios Private Equity: Run IRR scenarios by exit year FP&A: Budget vs actuals vs forecast comparisons |
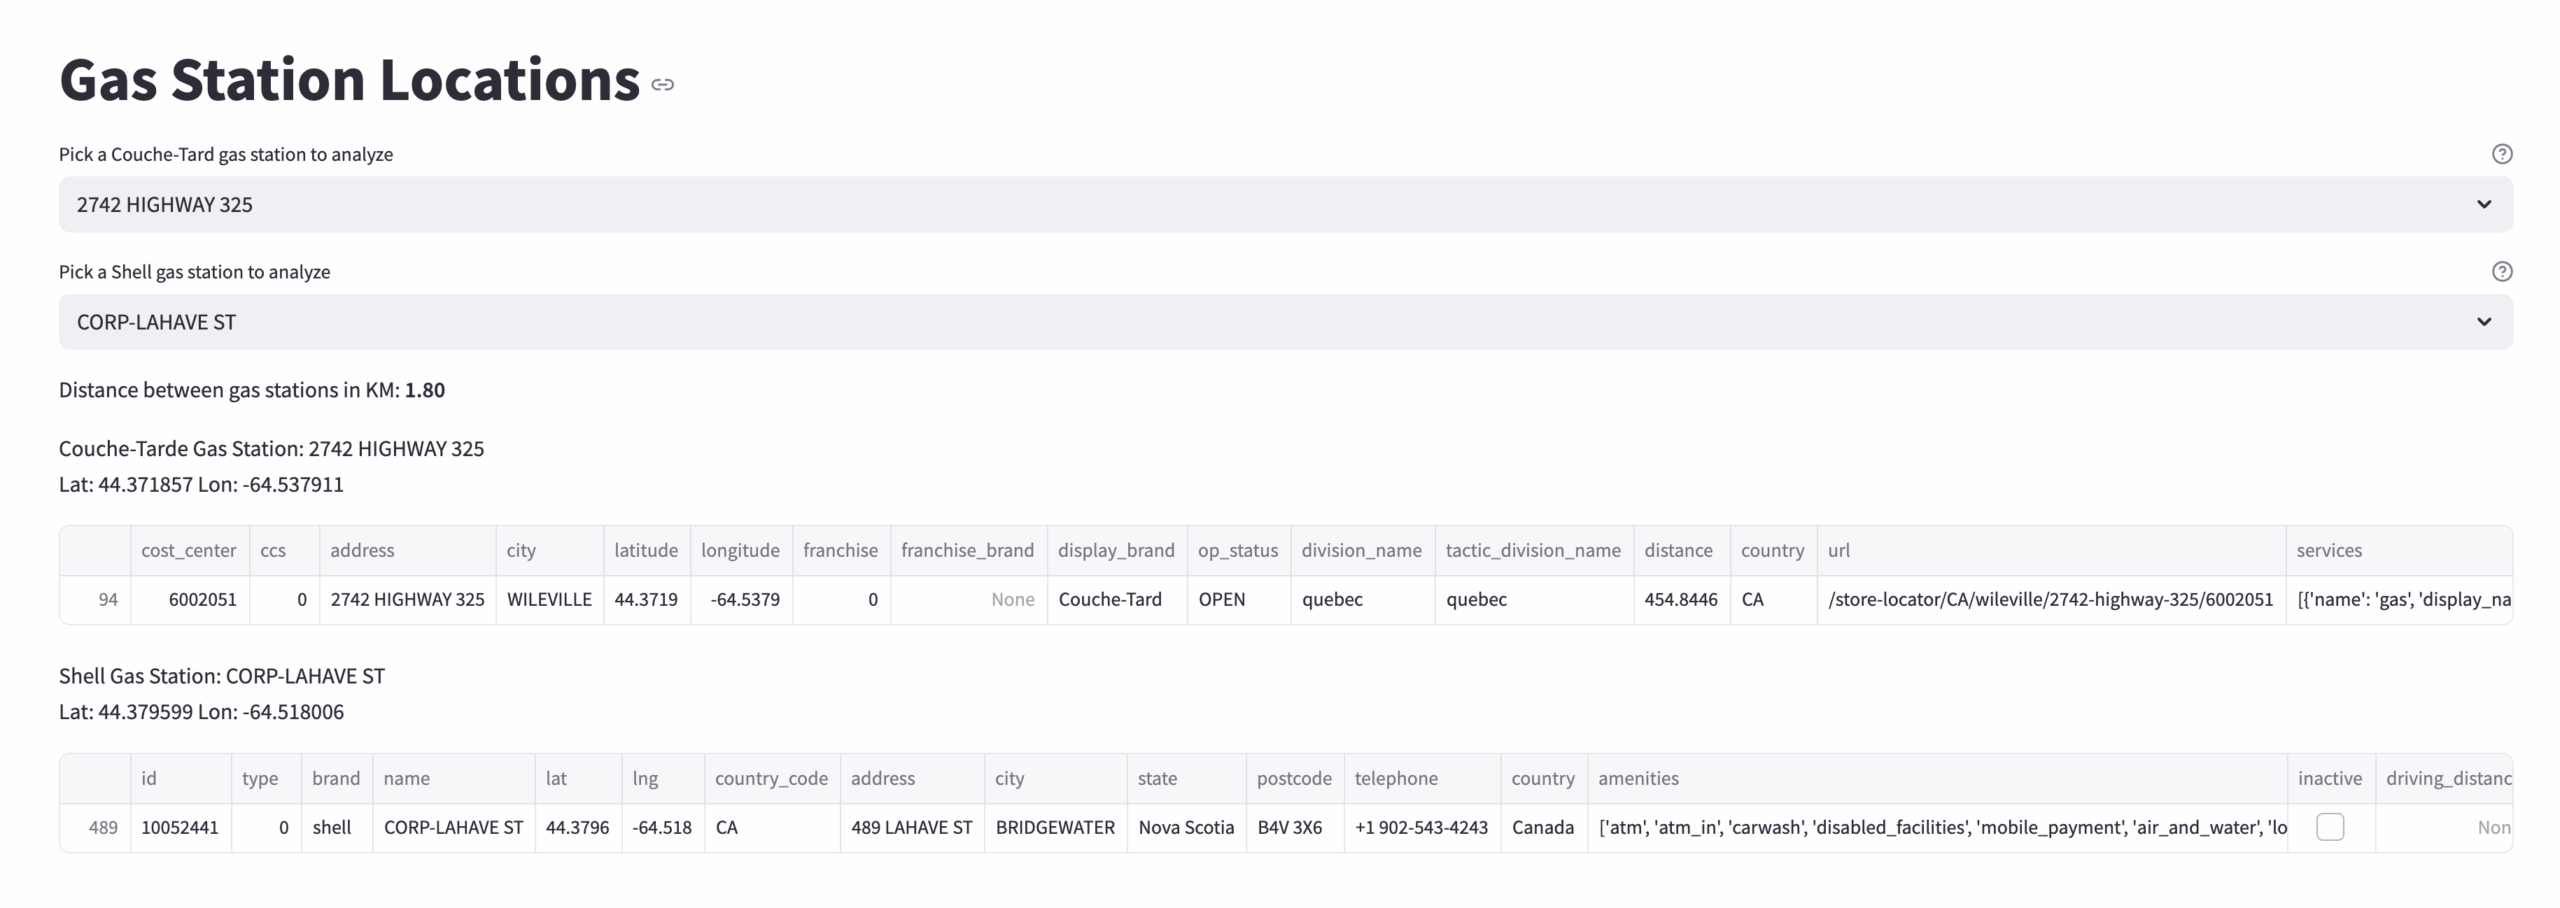 Link: Gas Station Locator Dashboard A demo of how Python can be used in an M&A deal to assist with cost synergy analysis. An interactive dashboard that plots gas station locations of Couche-Tard and Shell Canada. Users can select a gas station and define a kilometer radius to locate all stations within that distance. Options Calculator
 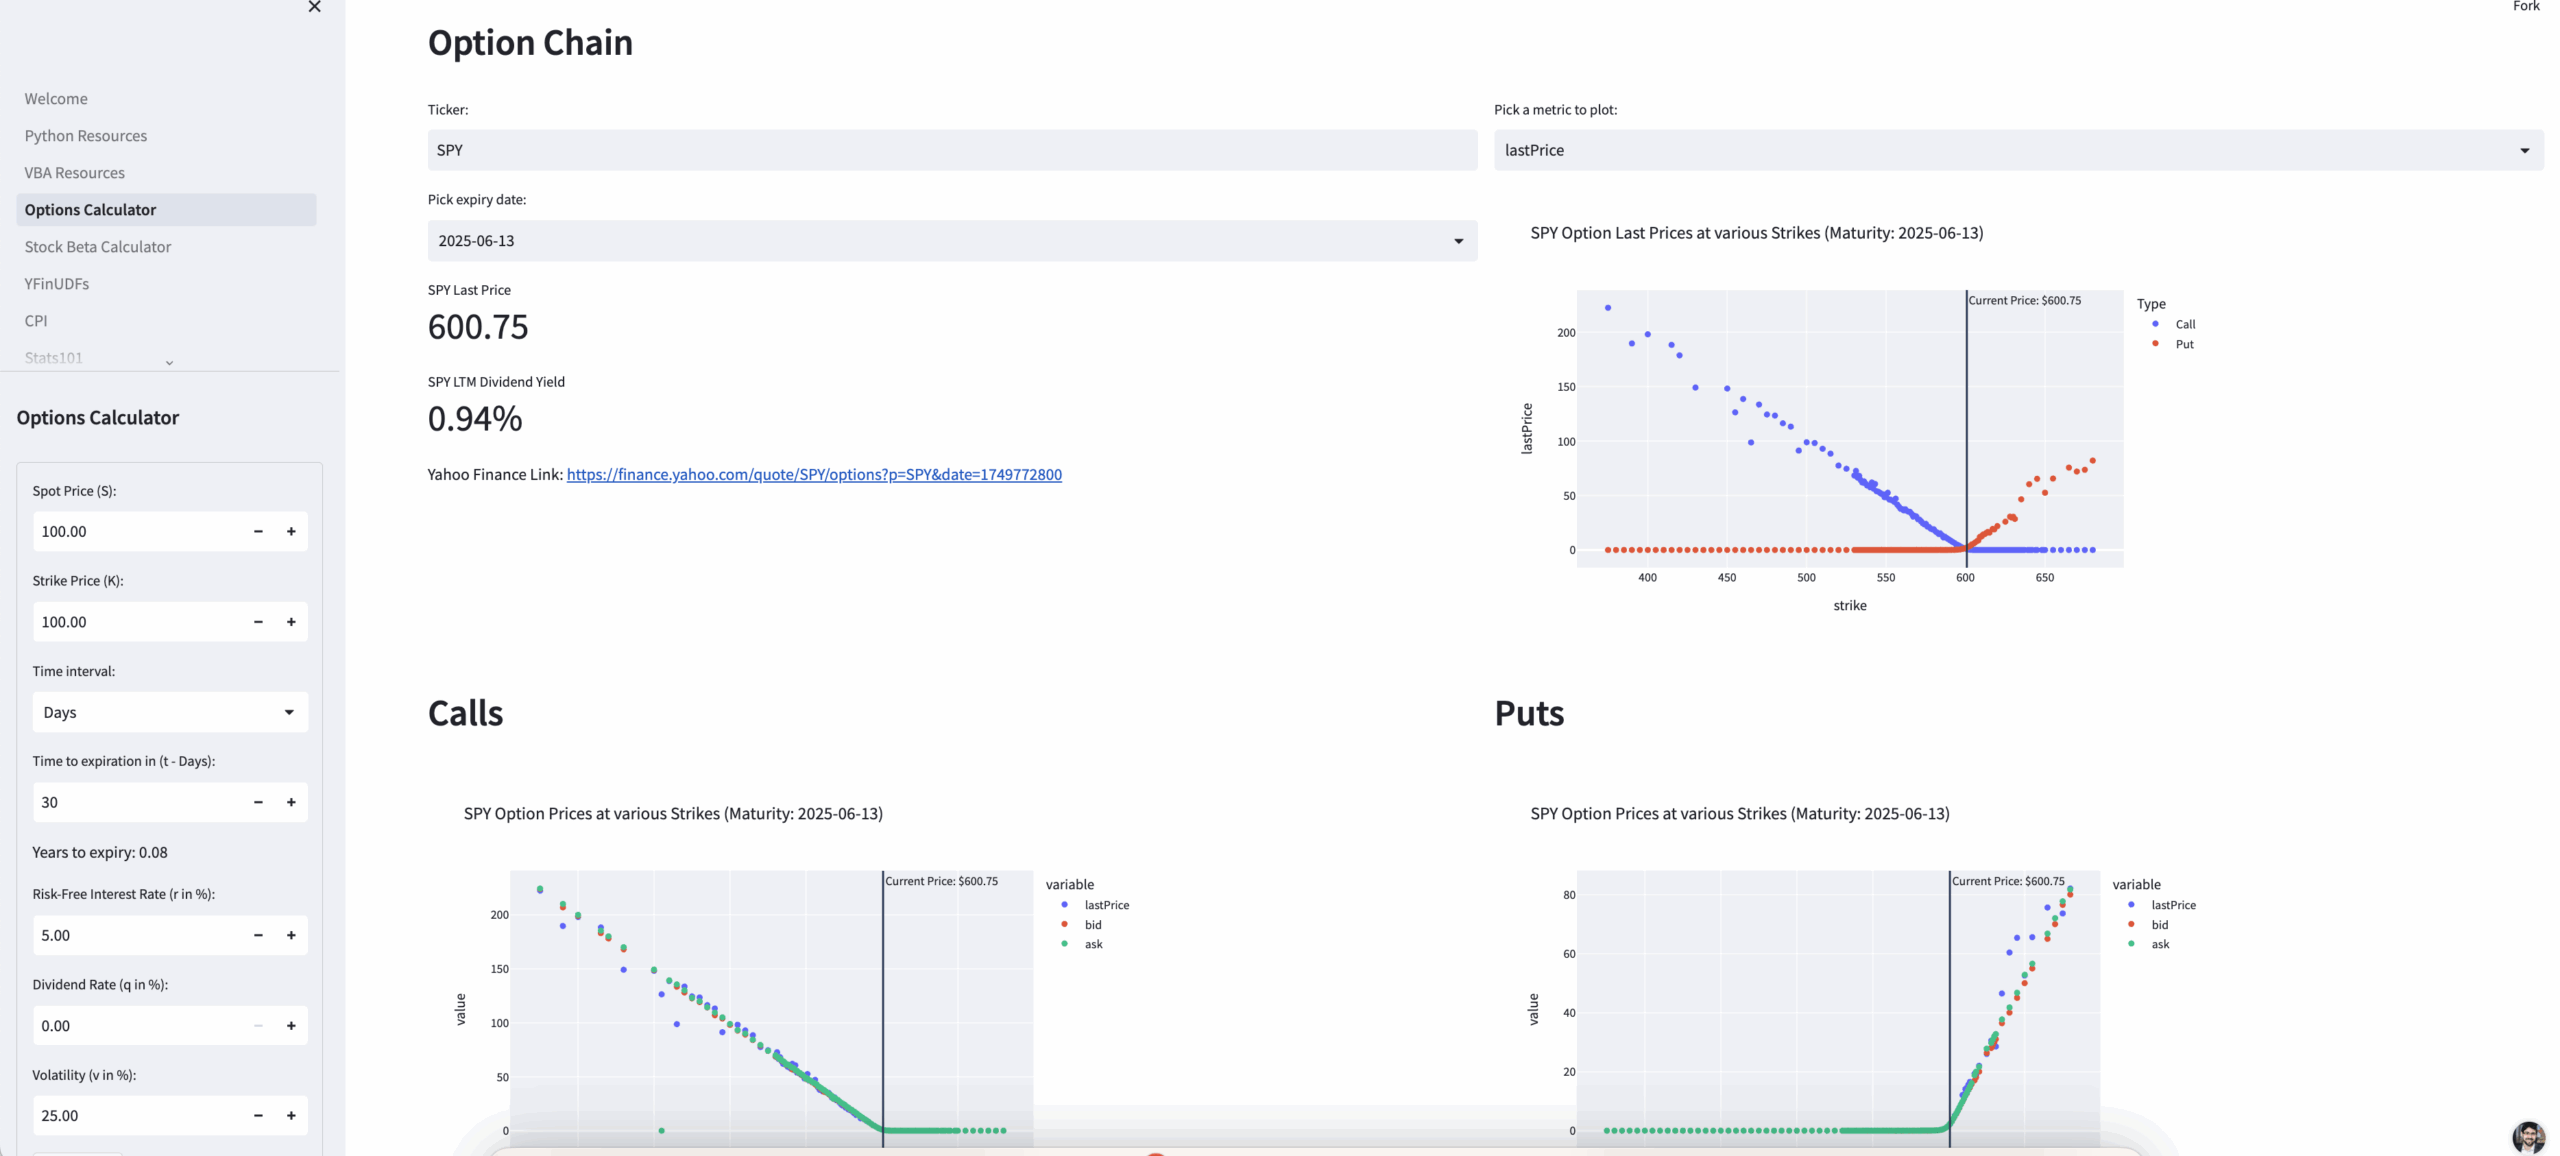 Link: Options Calculator This dashboard calculates the value of call and put options using the Black-Scholes model. It also allows users to scrape options chains from Yahoo Finance for a particular ticker and visualizes strike prices versus implied volatility and bid/ask/last prices.
 Master the basics of creating dynamic, web-friendly charts that respond to user actions like zooming, hovering, and filtering. These libraries are ideal for building live dashboards that track KPIs, portfolio performance, or market activity.
Learn how to organize and present charts and controls within interactive dashboards. Use tabs, sidebars, and filters to create professional reporting tools that resemble analyst terminals or internal BI platforms.
Enhance user experience with dropdowns, sliders, radio buttons, and time filters. Use callbacks to link these controls to real-time chart updates, allowing stakeholders to drill into specific assets, sectors, or date ranges.
4. Automate Data Loading and Preprocessing
Use Python to automate importing and cleaning datasets from Excel, APIs, SQL databases, or PDFs. Streamline your workflow so that dashboards always reflect the latest available data.
5. Deploy and Share Dashboards Effectively
Learn to export dashboards as standalone HTML files or host them online with services like Streamlit Cloud or Dash Enterprise. Allow teammates, clients, or executives to interact with your work—without needing Python installed.
As the volume and complexity of financial data continue to grow, dashboards have become an essential interface between raw data and decision-making. Python empowers finance professionals to go beyond static reporting—enabling the creation of dynamic, interactive dashboards that reflect real-time data, support scenario analysis, and surface key insights on demand.
The skills developed in building dashboards—such as connecting to live data, enabling user interactivity, and structuring outputs for clarity—are directly applicable across the financial sector. Whether it’s monitoring portfolio performance, visualizing deal pipelines, or tracking financial KPIs, Python-based dashboards are now critical tools on the desks of analysts and executives alike.
For those looking to build the skills to design and deploy dashboards with Python, we highly recommend our Python 3 Course: Dashboarding for Finance.
Learn the essentials of Dashboarding with our Python Dashboarding Course. Learn:
Web “scraping” is a generic term that means aggregating or extracting data from websites. Scraping can be done by opening a browser from within a programming language, navigating to a specific website and then downloading the data from that web page either directly into the programming language or as separate files. Sometimes, a browser doesn’t even need to be opened and the programming language code can access the data directly from the server.
While sometimes simple to do, web scraping can be one of the hardest things to code in a programming language, due to the complexity and variability in how information is stored on websites. For more complex websites, prior knowledge of web design (HTML, CSS, JavaScript) is helpful; however, with a bit of trial and error, and by using the web scraping packages available in Python, one can quickly get the data downloaded in the proper format.
If the data is displayed in a tabular format on the website, it can easily be scraped with the Pandas package mentioned in the previous section. Otherwise, data can be extracted using a combination of the Beautiful Soup package and a package to connect to the website (e.g. requests or urllib3). Selenium is also used if there is a need for interaction with the site (e.g. logging in, clicking on a button, or filling out a form).
Business and finance professionals use web scraping with Python to perform more extensive due diligence on their clients, competitors, or potential investments, such as analyzing store locations or grabbing pricing and inventory information on products.
Web scraping is an essential tool for financial analysts, researchers, and fintech professionals who need to automate data collection from websites, APIs, and online filings. Whether you’re building a corporate due diligence engine, tracking competitor prices, or extracting real-time market data, these four Python libraries are foundational to your workflow:
Acquiring Data from Websites (“Web Scraping”):
Connecting to Financial APIs
Expand your toolkit by connecting with APIs like Bloomberg, IEX Cloud, and FRED to ingest high-quality market and economic data for deeper analysis and visualization.
Real-Time Price Feeds and Trading Signals
Implement live data pipelines to monitor price movements, calculate technical indicators, or trigger alerts—capabilities that are invaluable for trading desks and asset managers.BeautifulSoup and Selenium to extract insights from unstructured data sources such as 10-K filings, press releases, job postings, or even consumer sentiment platforms.
Website and Documentation: https://requests.readthedocs.io/en/master/
Requests is a simple yet powerful HTTP library for sending GET and POST requests to web servers. It’s used to retrieve HTML pages, JSON data, and API responses. Requests allows you to automate the downloading of financial filings, earnings press releases, market data from APIs (like Yahoo Finance), or pages from investor relations websites. It’s often the first step in any web scraping pipeline—retrieving the raw content that other tools (like Beautiful Soup) will parse.

Website: https://urllib3.readthedocs.io/en/latest/ Documentation: https://urllib3.readthedocs.io/en/latest/user-guide.html
Urllib is Python’s built-in module for working with URLs—handling requests, parsing URLs, and managing query strings. Although less user-friendly than Requests, Urllib is useful for low-level operations and is especially helpful when managing query parameters for dynamic data downloads or authentication flows. It also allows for passing of custom headers and parameters when connecting to websites to simulate using specific browsers (e.g. website sees you are coming from Chrome instead of Python) or for requesting specific loading parameters (e.g. request that 100 products are loaded on a page instead of 50). It’s often used in conjunction with other scraping tools when custom URL manipulation is required.

Website: https://www.crummy.com/software/BeautifulSoup/ Documentation: https://www.crummy.com/software/BeautifulSoup/bs4/doc/
Beautiful Soup is a powerful Python library for parsing HTML and XML documents. It allows you to navigate the structure of web pages and extract data based on tags, classes, IDs, and other attributes; and Allows for more advanced scrapes for data not structured in tables and that cannot be handled by the Pandas read_html() function. Beautiful Soup is ideal for scraping and extracting structured financial data from static websites—such as tables of earnings, SEC filings, company leadership bios, or market commentary. It’s widely used in due diligence and competitive analysis projects.
Website: https://www.selenium.dev/ Documentation: https://selenium-python.readthedocs.io/
Selenium is a browser automation tool that simulates user interactions—like clicking, scrolling, and typing—on websites. It controls a real browser (e.g., Chrome or Firefox) to interact with dynamic pages rendered by JavaScript. Many modern websites (e.g., trading platforms, alternative data sources) use JavaScript to load content dynamically. Selenium is essential for scraping such content—especially for interactive dashboards, login-protected pages, or on-demand data feeds.
Web-scraping is an incredibly powerful tool for automating corporate research and extracting structured data from regulatory filings; web scraping allows analysts to unlock valuable insights that are often buried in websites, PDFs, or dynamic online platforms.
The sections below outline the key ways Python is being used for web scraping across finance – supporting activities such as due diligence, market research, pricing analysis, alternative data aggregation, and automated model updates.
Key Tools: requests, BeautifulSoup, urllib, pandas.read_html, pdfplumber, tabula, Selenium
| Activity | Description | Sector Use Cases |
|---|---|---|
| Automate data collection from HTML, JSON, XML, PDFs | Extract structured and semi-structured data from websites or documents | Investment Banking: Scrape M&A deal lists or company bios from investor websites Private Equity: Extract portfolio data or operating metrics from portfolio company pages Equity Research: Pull analyst coverage or company press releases |
| Aggregate alternative data | Collect non-traditional financial data such as pricing, store locations, reviews, and product details | Private Equity: Scrape Amazon or Shopify stores for product pricing Global Markets: Gather sentiment data from job listings or consumer websites Asset Management: Scrape fund factsheets and performance metrics |
| Competitor analysis and benchmarking | Automate the extraction of KPIs, pricing, news, or activity from peer firms | Equity Research: Scrape peer valuations and news FP&A: Track competitor pricing, announcements, or product launches |
| Web scraping of financial filings | Extract financial tables and narrative sections from 10-Ks, 10-Qs, and SEDAR/EDGAR data | Investment Banking: Gather revenue, debt, or segment information for pitch materials FP&A: Analyze peer disclosures for benchmarking Bond Market: Extract issuer risk factors or covenants |
| Automate browser interaction (Selenium) | Access login-protected or dynamic websites that require user interaction | Private Equity: Download investor reports behind logins Asset Management: Navigate and extract fund holdings from provider portals Hedge Funds: Access proprietary trading tools for pricing data |
| Convert PDFs to structured data | Scrape tables from documents like investor presentations, earnings decks, or regulatory filings | Equity Research: Extract tables from PDF earnings transcripts Private Equity: Extract and standardize financial data from portfolio reports |
Key Tools: requests, urllib, yfinance, IEX Cloud, FRED, EDGAR, Alpha Vantage, Bloomberg (via Excel or third-party
| Activity | Description | Sector Use Cases |
|---|---|---|
| Pull real-time or historical data from financial APIs | Access data feeds for prices, earnings, rates, or macro indicators | Hedge Funds: Real-time price feeds for signal generation Asset Management: Retrieve daily NAVs or index data Equity Research: Update models with latest earnings or macro indicators |
| Automate data ingestion for modeling and dashboards | Integrate API data directly into Python workflows or dashboards | FP&A: Pull FX rates or inflation data into budget models Bond Market: Import treasury rates, credit spreads Global Markets: Automate macro data feeds for strategy reports |
| Build custom alerts and data pipelines | Create scripts that check for thresholds, trends, or market triggers | Hedge Funds: Trigger trading signals based on price or volume Equity Research: Alert on earnings surprises or filings Private Equity: Monitor competitor deal announcements |
Python’s application in finance is diverse and impactful:
Example 1: Scraping data from PDF’s
One of the most common activities that any Analyst can relate to, is the arduous process of taking data that is locked in a PDF, and getting it into excel. This demo shows how with a few lines of code how Analysts can pull and format data into Python.
Example 2: Using the FRED API for Federal Reserve Data
This demo shows how Python can be used with the FRED API to access and work with various economic data like: Interest rates (e.g., Fed Funds Rate, Treasury yields), GDP, CPI, inflation, employment, Global macroeconomic indicators, Financial markets, Consumer sentiment, and thousands of other economic series
The FRED API is an application programming interface provided by the Federal Reserve Bank of St. Louis that allows developers and analysts to programmatically access economic data from the Federal Reserve Economic Data (FRED) database.
Web Scraping: https://bit.ly/MqWeb
You can use Python to automate tasks such as web scraping, data aggregation, and analysis. This can save time and money during the due diligence M&A process.
Example: Retailer M&A analysis
Python Application: Extract all Target retail locations and analyze proximity to Acquirer locations. Use this data to calculate synergy benefits of closing stores within a predetermined radius.
Example: Consumer Product M&A analysis
Python Application: Extract and analyze all competitor product information on retailing websites. Ability to track volumes and pricing over time and compare Target and Acquirer product strategies.
Python can be used to model and analyze risk. You can use this to identify and mitigate risks before they occur.
Building outreach lists, managing document collections.
Example: Identify cold-call reach out list for teaser
Python Application: Scrape names and job title from corporate or industry websites to create a contact list for a CIM.
Example: PIB construction and document collection
Python Application: Access, download and organize all the files on a company’s website or public filing record in a single step.
Extracting and summarizing financial data over multiple years.
Example: Build custom financial analysis over multiple years
Python Application: Simultaneously access multiple document types (10K’s, 10Q’s, investor presentation decks) and retrieve specific information to summarize and analyze trends over time in a single step.
Example: Create industry trend summaries
Python Application: Access and compile usable database information such as airplane passenger data from major airports, occupancy rates for hotels and other published industry data for use in forecasts.
Creating databases of deal activity and portfolio investments.
Example: Create database of competitor deal activity or portfolio investments
Python Application: Extract deal data into a usable form from deal tombstones or portfolio summaries and other graphical information on competitor websites
Filtering and analyzing investment data to derive insights.
Example: Filter and analyze large data sets from investment companies
Python Application: Analyze millions of rows of credit card data from investment companies to better understand store dynamics, customer relationships and other KPIs
1. Learn the Fundamentals of HTTP and Data Retrieval
Requests and Urllib3. Understand how to retrieve raw HTML, JSON, or CSV files from public URLs or APIs, including financial data sources like Yahoo Finance, FRED, or EDGAR. Explore how to extract structured data from HTML using Beautiful Soup. Learn to identify and pull content from tags, classes, and IDs—practice scraping tables of earnings data, investor presentations, and company bios.
Use Selenium to simulate real user interactions like clicking buttons, logging in, or filling out search forms. This is essential for scraping data from JavaScript-heavy or dynamic websites that require navigation through multiple pages or dropdowns.
Learn how to build scripts that extract data from PDFs, JSON/XML APIs, and poorly structured HTML pages. This is particularly useful for sourcing competitor intelligence, consumer sentiment, or geographic store data.
5. Try to Apply Repeatable Web Scraping Pipelines to Financial Analysis
Create scalable workflows that scrape, clean, and save data for due diligence, M&A research, portfolio monitoring, or risk modeling. Combine scraping with Pandas for downstream analysis, and automate regular data pulls to keep your datasets current.
Python’s web scraping and API capabilities have become indispensable for financial professionals who need to source data that isn’t readily available in structured formats. Whether it’s extracting financials from SEC filings, gathering pricing intelligence from competitor websites, or pulling real-time macroeconomic data through APIs, these skills allow analysts to move beyond traditional data sources and build a deeper, more customized view of the markets and companies they cover.
The ability to automate data collection not only saves time but also enables scalable, repeatable processes that can feed directly into models, dashboards, and investment workflows. For teams working in research, trading, due diligence, or financial planning, this means faster insights, broader data coverage, and improved decision-making.
For those looking to develop web scraping and API integration skills in a structured, finance-focused environment, we highly recommend our Python 3b: Web Scraping and APIs for Finance.
Learn the essentials of webscraping in Python and handle real-world data challenges. Learn:
Coming soon.
Coming soon.
Coming soon.
VBA is still considered the pinnacle programming language for financial professionals due to its integration with Microsoft Office applications
VBA is great when specific objects or things are manipulated inside Excel (such as inserting or deleting sheets, cells, formatting tables, charts, etc.)
However, when it comes to data manipulation, aggregation, or more complex analysis, Python is easier to use. Not only is Python easier to write (it looks more like “plain English” than VBA does) but some programs could take hundreds of lines of code in VBA while only a dozen in Python
VBA also runs into the same issues as Excel when working with larger data sets, because at the end of the day it is still manipulating the data inside Excel
During this hands-on course, participants will work with Python and several popular packages to create programs that acquire, consolidate, analyze and present large data sets. Whether originated from websites or internal databases, this course will demonstrate core techniques to efficiently manage and explore business data through interactive dashboards.
Python’s popularity is surging in finance, as it outshines other programs like VBA, R, and even Excel. In addition, Python’s versatility as a full-fledged programming language, combined with its ease of learning and extensive package support, has made it the preferred choice for modern financial analysis.
Financial charts and graphs:
Python’s plotting libraries, such as Matplotlib and Seaborn, allow analysts to turn raw data into visual insights. With a few commands, you can plot a stock’s price history, visualize trading volumes, or create a bar chart of a portfolio’s asset allocation. These libraries are highly customizable, enabling finance teams to produce publication-quality visuals for reports. For example, an investment analyst might use Python to generate a line chart of a company’s quarterly earnings over several years, complete with trend lines and annotations, to include in a client presentation. Python’s capabilities here mean that analysts aren’t limited to Excel’s chart options – they can tailor visuals exactly to their needs. The combination of analytical power and visualization is potent: after performing calculations, it’s easy to directly display the results graphically in an approachable manner with Python.
Data Cleaning
Packages like pandas (Python’s premier data analysis library) allows users to take messy data and clean and organize it into usable formats. With a few lines of code, users can perform actions like removing unneeded rows/columns, removing NA’s , and normalizing or aggregating data.
Visual storytelling:
Whether it’s an investment committee presentation or a client-facing research report, the narrative often revolves around charts and visuals. Python helps create compelling visual stories from complex data. For instance, a strategist could use Python to produce a heatmap of correlations between different asset classes to discuss diversification benefits, or generate an interactive graph of scenario outcomes for an economic forecast. By visualizing data effectively, analysts ensure that the key messages (e.g., “our model predicts a range of outcomes, mostly clustered around 5-7% returns”) are understood at a glance. In the era of information overload, clear and insightful visuals are crucial, and Python is one of the tools making that possible.
Website: https://scikit-learn.org/stable/
Documentation: https://scikit-learn.org/stable/getting_started.html
There are also higher level artificial intelligence packages that have been “trained” and perfected over the years with machine learning algorithms that can be used right away in practical applications:
Optical Character Recognition (OCR) is a branch of AI that allows computers to recognize text in images or scanned documents. The steps for using OCR in Python are:
The image processing is usually achieved with a package such as OpenCV and Google’s Tesseract is used for the text recognition.
In addition, Natural Language Processing (NLP) is a branch of machine learning and AI that allows computers to understand human language and classifies and groups togethers parts of text to extract key information. NLP is used on a daily basis in interactions with Google Home, Siri, Alexa and chatbots and in the finance and business community it is primarily used to extract key data from press releases and articles. It is also used to an extent to determine the “sentiment” of an article, tweet, filing etc. Two popular Python packages used for NLP are NLTK and SpaCy.
Cleaning and Structuring Large Datasets
Learn how to process and format raw financial data—such as earnings reports or transaction logs—using Python libraries like pandas to ensure consistency and usability for analysis.
Automating Excel Workflows with pandas and openpyxl
Replace repetitive spreadsheet tasks with automated scripts that can update financial models, generate summaries, and populate dashboards—all with minimal manual effort.
Pulling in Data from APIs
Gain proficiency in retrieving financial data programmatically from sources like Yahoo Finance, FRED, and EDGAR, enabling you to keep your analyses up-to-date with real-time inputs.
Creating Repeatable Workflows
Use Python to develop end-to-end processes for recurring tasks, such as monthly reporting, performance tracking, or model refreshes, ensuring accuracy, speed, and reproducibility.
1. Learn the Foundations of Machine Learning with scikit-learn
Start by mastering scikit-learn, Python’s core library for machine learning. Learn to build, train, and evaluate models for classification, regression, and clustering—key techniques for tasks like credit scoring, price prediction, and customer segmentation.
2. Clean and Prepare Financial Datasets for Modeling
Learn how to structure your data for machine learning: split data into training and testing sets, create dummy variables for categories, handle outliers, and scale inputs. Preprocessing is critical for producing reliable financial models.
3. Apply Supervised Learning for Forecasting and Scoring
Use classification to categorize financial records (e.g., credit rating prediction), and regression to forecast continuous variables (e.g., stock returns, company valuation) based on multiple financial factors.
4. Explore Unsupervised Learning for Pattern Discovery
Understand how clustering and dimensionality reduction techniques can group similar companies, customers, or assets based on behavioral or financial patterns—ideal for portfolio diversification, risk segmentation, or market structure analysis.
5. Dive into AI Tools: NLP and OCR for Unstructured Data
Learn to extract text from documents using PyTesseract and OpenCV (OCR), and analyze language using SpaCy or NLTK (NLP). These tools are vital for automating the review of 10-K filings, parsing press releases, and performing sentiment analysis on financial news.
concluding thoughts
Master Python for Core Data Analysis
Learn the essentials of Python programming and data analysis to build a strong foundation for handling real-world data challenges.
Financial charts and graphs:
Python’s plotting libraries, such as Matplotlib and Seaborn, allow analysts to turn raw data into visual insights. With a few commands, you can plot a stock’s price history, visualize trading volumes, or create a bar chart of a portfolio’s asset allocation. These libraries are highly customizable, enabling finance teams to produce publication-quality visuals for reports. For example, an investment analyst might use Python to generate a line chart of a company’s quarterly earnings over several years, complete with trend lines and annotations, to include in a client presentation. Python’s capabilities here mean that analysts aren’t limited to Excel’s chart options – they can tailor visuals exactly to their needs. The combination of analytical power and visualization is potent: after performing calculations, it’s easy to directly display the results graphically in an approachable manner with Python.
Data Cleaning
Packages like pandas (Python’s premier data analysis library) allows users to take messy data and clean and organize it into usable formats. With a few lines of code, users can perform actions like removing unneeded rows/columns, removing NA’s , and normalizing or aggregating data.
Visual storytelling:
Whether it’s an investment committee presentation or a client-facing research report, the narrative often revolves around charts and visuals. Python helps create compelling visual stories from complex data. For instance, a strategist could use Python to produce a heatmap of correlations between different asset classes to discuss diversification benefits, or generate an interactive graph of scenario outcomes for an economic forecast. By visualizing data effectively, analysts ensure that the key messages (e.g., “our model predicts a range of outcomes, mostly clustered around 5-7% returns”) are understood at a glance. In the era of information overload, clear and insightful visuals are crucial, and Python is one of the tools making that possible.
Website: https://scikit-learn.org/stable/ Documentation: https://scikit-learn.org/stable/getting_started.html
There are also higher level artificial intelligence packages that have been “trained” and perfected over the years with machine learning algorithms that can be used right away in practical applications:
Optical Character Recognition (OCR) is a branch of AI that allows computers to recognize text in images or scanned documents. The steps for using OCR in Python are:
The image processing is usually achieved with a package such as OpenCV and Google’s Tesseract is used for the text recognition.
In addition, Natural Language Processing (NLP) is a branch of machine learning and AI that allows computers to understand human language and classifies and groups togethers parts of text to extract key information. NLP is used on a daily basis in interactions with Google Home, Siri, Alexa and chatbots and in the finance and business community it is primarily used to extract key data from press releases and articles. It is also used to an extent to determine the “sentiment” of an article, tweet, filing etc. Two popular Python packages used for NLP are NLTK and SpaCy.
:Cleaning and Structuring Large Datasets
Learn how to process and format raw financial data—such as earnings reports or transaction logs—using Python libraries like pandas to ensure consistency and usability for analysis.
Automating Excel Workflows with pandas and openpyxl
Replace repetitive spreadsheet tasks with automated scripts that can update financial models, generate summaries, and populate dashboards—all with minimal manual effort.
Pulling in Data from APIs
Gain proficiency in retrieving financial data programmatically from sources like Yahoo Finance, FRED, and EDGAR, enabling you to keep your analyses up-to-date with real-time inputs.</p
Creating Repeatable Workflows
Use Python to develop end-to-end processes for recurring tasks, such as monthly reporting, performance tracking, or model refreshes, ensuring accuracy, speed, and reproducibility.
Familiarize yourself with Python, Core Logic, and Data Structures
Learn how to process and format raw financial data—such as earnings reports or transaction logs—using Python libraries like pandas to ensure consistency and usability for analysis.
Learn how to find, import, clean, and sort large financial datasets
Learn how to process and format raw financial data—such as earnings reports or transaction logs—using Python libraries like pandas to ensure consistency and usability for analysis.
Learn some basics of Automating Excel Workflows with pandas and openpyxl
Replace repetitive spreadsheet tasks with automated scripts that can update financial models, generate summaries, and populate dashboards—all with minimal manual effort.
Learn to Pull Data from APIs
Gain proficiency in retrieving financial data programmatically from sources like Yahoo Finance, FRED, and EDGAR, enabling you to keep your analyses up-to-date with real-time inputs.
Creating Repeatable Workflows
Use Python to develop end-to-end processes for recurring tasks, such as monthly reporting, performance tracking, or model refreshes, ensuring accuracy, speed, and reproducibility.
Master Python for Core Data Analysis
Learn the essentials of Python programming and data analysis to build a strong foundation for handling real-world data challenges.
The most common use case for Python in the finance industry is data analysis- working with (sourcing, organizing, cleaning, sorting) and interpreting (analyzing, filtering, structuring) large volumes of data for the purpose of analysis and reporting.
This is where most student’s journey’s with Python begin, as data analysis is the foundation of all further uses of data. Generally this involves installing Python’s Anaconda linrary, Jyupiter notebooks – and working with pandas and NumPy.
Activities within this use case might include things like:
Data Gathering (Databases & Files)
One of the core features of Pandas, is the ability to import and source financial data in a format that can be worked with by code. Pandas offers off the shelf ways to importing data from Excel, CSV files, PDFs, SQL databases, and more.
Data Gathering (API’s)
Moreover, with the power of API’s – Python makes it straightforward to fetch financial data from the web. Whether it’s pulling stock prices from Yahoo Finance or economic indicators from the Federal Reserve’s FRED database, Python has libraries and APIs to grab that information in real time. For instance, an analyst can use Python to hit an API endpoint each morning and retrieve the latest foreign exchange rates or market news, integrating those into their analysis automatically.
Data Aggregation & Cleaning
Packages like pandas (Python’s premier data analysis library) allows users to take messy data and clean and organize it into usable formats. With a few lines of code, Analysts can perform many complex operations on otherwise unwieldily financial datasets – performing actions like normalizing earnings data, aggregating transaction logs, or .
Data Analysis
Once organized, packages like pandas offers many tools for analyzing and reporting on data, including summarizing data, adding custom formulas, sorting, filtering, and pivot tables.
Website: https://scikit-learn.org/stable/ Documentation: https://scikit-learn.org/stable/getting_started.html
There are also higher level artificial intelligence packages that have been “trained” and perfected over the years with machine learning algorithms that can be used right away in practical applications:
Optical Character Recognition (OCR) is a branch of AI that allows computers to recognize text in images or scanned documents. The steps for using OCR in Python are:
The image processing is usually achieved with a package such as OpenCV and Google’s Tesseract is used for the text recognition.
In addition, Natural Language Processing (NLP) is a branch of machine learning and AI that allows computers to understand human language and classifies and groups togethers parts of text to extract key information. NLP is used on a daily basis in interactions with Google Home, Siri, Alexa and chatbots and in the finance and business community it is primarily used to extract key data from press releases and articles. It is also used to an extent to determine the “sentiment” of an article, tweet, filing etc. Two popular Python packages used for NLP are NLTK and SpaCy.
Cleaning and Structuring Large Datasets
Learn how to process and format raw financial data—such as earnings reports or transaction logs—using Python libraries like pandas to ensure consistency and usability for analysis.
Automating Excel Workflows with pandas and openpyxl
Replace repetitive spreadsheet tasks with automated scripts that can update financial models, generate summaries, and populate dashboards—all with minimal manual effort.
Pulling in Data from APIs
Gain proficiency in retrieving financial data programmatically from sources like Yahoo Finance, FRED, and EDGAR, enabling you to keep your analyses up-to-date with real-time inputs.
Creating Repeatable Workflows
Use Python to develop end-to-end processes for recurring tasks, such as monthly reporting, performance tracking, or model refreshes, ensuring accuracy, speed, and reproducibility.
Financial charts and graphs:
Python’s plotting libraries, such as Matplotlib and Seaborn, allow analysts to turn raw data into visual insights. With a few commands, you can plot a stock’s price history, visualize trading volumes, or create a bar chart of a portfolio’s asset allocation. These libraries are highly customizable, enabling finance teams to produce publication-quality visuals for reports. For example, an investment analyst might use Python to generate a line chart of a company’s quarterly earnings over several years, complete with trend lines and annotations, to include in a client presentation. Python’s capabilities here mean that analysts aren’t limited to Excel’s chart options – they can tailor visuals exactly to their needs. The combination of analytical power and visualization is potent: after performing calculations, it’s easy to directly display the results graphically in an approachable manner with Python.
Data Cleaning
Packages like pandas (Python’s premier data analysis library) allows users to take messy data and clean and organize it into usable formats. With a few lines of code, users can perform actions like removing unneeded rows/columns, removing NA’s , and normalizing or aggregating data.
Visual storytelling:
Whether it’s an investment committee presentation or a client-facing research report, the narrative often revolves around charts and visuals. Python helps create compelling visual stories from complex data. For instance, a strategist could use Python to produce a heatmap of correlations between different asset classes to discuss diversification benefits, or generate an interactive graph of scenario outcomes for an economic forecast. By visualizing data effectively, analysts ensure that the key messages (e.g., “our model predicts a range of outcomes, mostly clustered around 5-7% returns”) are understood at a glance. In the era of information overload, clear and insightful visuals are crucial, and Python is one of the tools making that possible.
Familiarize yourself with Python, Core Logic, and Data Structures
Learn how to process and format raw financial data—such as earnings reports or transaction logs—using Python libraries like pandas to ensure consistency and usability for analysis.
Learn how to find, import, clean, and sort large financial datasets
Learn how to process and format raw financial data—such as earnings reports or transaction logs—using Python libraries like pandas to ensure consistency and usability for analysis.
Learn some basics of Automating Excel Workflows with pandas and openpyxl
Replace repetitive spreadsheet tasks with automated scripts that can update financial models, generate summaries, and populate dashboards—all with minimal manual effort.
Learn to Pull Data from APIs
Gain proficiency in retrieving financial data programmatically from sources like Yahoo Finance, FRED, and EDGAR, enabling you to keep your analyses up-to-date with real-time inputs.
Creating Repeatable Workflows
Use Python to develop end-to-end processes for recurring tasks, such as monthly reporting, performance tracking, or model refreshes, ensuring accuracy, speed, and reproducibility.
Master Python for Core Data Analysis
Learn the essentials of Python programming and data analysis to build a strong foundation for handling real-world data challenges.