Looking to supercharge your data analytics skills?
With a focus on hands-on learning, you’ll learn to use Python to build and analyze financial models, visualize data, and gain practical experience applying these skills to real-world financial scenarios.
Not only will you learn essential Python skills, but you’ll also gain practical experience applying Python to real-world financial scenarios. Whether you’re a seasoned financial analyst or just starting your finance career, our course will help you take your skills to the next level.
Our Python training is offered in three parts – detailed course syllabus below.
Invest in your future and enroll in Training The Street’s Python Training courses today!
Python 1 – Core Data Analysis
During this hands-on course, participants will gain the skills needed to develop Python programs to solve typical Finance problems, cutting through the noise of generic “Data Science” courses. Participants will be introduced to best-practices programming in Python to clean, analyze, and visualize financial data.
Using Python:
- Develop familiarity with the Anaconda Python Distribution
- Manage environments and installing packages
- Gain familiarity with open source Python Development Environments
- Learn how to write programs in Python and developing an understanding for data structures, functions, loops, logical operations and other programming best practices
Data Collection, Cleaning, Manipulation, and Visualization:
- Import data from various sources (e.g.: CSV, Excel, HTML) into pandas (a high-performance library of data structures)
- Develop the necessary skills to clean raw financial data, and gain familiarity in overcoming common issues with numerical data
- Merge data from various sources and leverage built-in functionality to gain efficiency
- Build programs to perform exploratory data analysis using basic statistical functions
- Develop the ability to create powerful visualizations using the pandas plotting functions
Python 2 – Visualization and Analysis
This hands-on course is intended for anyone who uses Python and who is already comfortable with the skills that were taught in “Python 1: Core Data Analysis”. This course continues to build the skills needed to develop Python programs to solve typical Finance problems, cutting through the noise of generic “Data Science” courses. Participants will be introduced to best-practices programming in Python to analyze and visualize Financial Data.
Data Visualization in Python:
- Develop the ability to create powerful visualizations using the matplotlib and seaborn packages
- Plot and interpret scatterplots and time series plots
- Format settings of graphs
- Learn to create and interpret more advanced graphs such as histograms and box plots
Data Analysis and Modeling:
- Gain experience in performing statistical analysis, linear regression, time series regression, and optimization
- Learn how to use statistical functions in popular data science packages such as statsmodels, SciPy, and scikit-learn
- Build and test financial market analyses to explore common tasks such as capital asset pricing, times series forecasting, multi-factor models and portfolio optimization
Python 3 – Web Scraping and Dashboarding
During this hands-on course, participants will work with Python and several popular packages to create programs that acquire, consolidate, analyze and present large data sets. Whether originated from websites or internal databases, this course will demonstrate core techniques to efficiently manage and explore business data through interactive dashboards.
Acquiring Data from Websites (“Web Scraping”):
- Automate corporate due diligence and data gathering by designing programs to download publicly available information from websites
- Aggregate alternative data from industry websites
- Create programs for competitor analysis and price comparisons
- Review API’s and Python packages used for web scraping, such as Requests, Urllib and Beautiful Soup to parse downloaded data into a format that can be analyzed and visualized
- Automate user interactions with websites using the Selenium package
- Extract financial and economic data from Yahoo Finance, EDGAR, FRED and other sources
- Learn to import data from various types of websites (HTML, JSON, XML, PDFs)
Automation, Visualization and Dashboarding:
- Build powerful visualizations using more advanced visualization packages such as Bokeh, Seaborn, and Plotly
- Create interactive dashboards and charts using Dash and Streamlit packages
- Tips for moving and creating folders on the fly and importing data from multiple source files
- Automate extracting and cleaning tables from PDF files
What Does A Day Look Like?


Course Details
What’s Included
Schedule
Prerequisites
How Do You Like To Learn?

Flexible Learning Options
Our courses are available in both in-person or virtual classroom formats. If you learn better in your own space or traveling isn’t convenient, virtual is great solution. Either way, you get the skills and support you need to succeed.

Course Pricing
Cancellation Policy
See what our students say

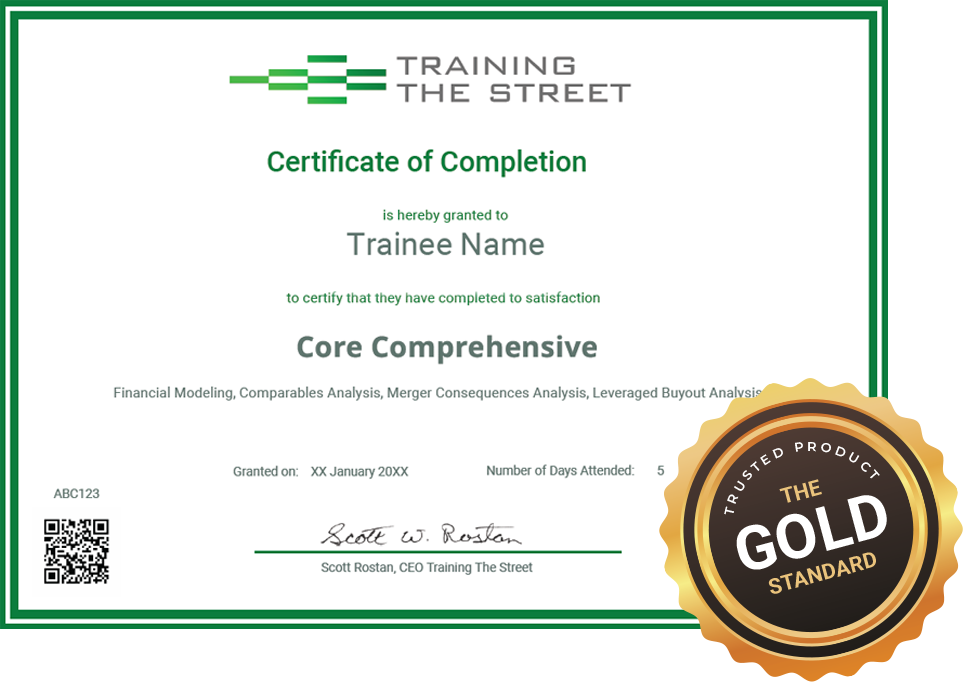
Training The Street has been teaching the biggest finance firms for over 20 years. To help unlock your career potential, we offer certificates to provide the recognition you deserve.
After you finish your course, you will receive a certificate which can be easily added to your LinkedIn profile.


