Data Tables in Excel: How to Set Up and Troubleshoot Sensitivity Analysis
Sensitivity analysis is one of the most routine deliverables in finance. A banker showing how enterprise value moves with EBITDA margin assumptions, an analyst stress-testing a debt model across interest rate scenarios, a PE associate presenting returns under different exit multiples. The output is almost always a grid: one variable across the top, one down the side, the relevant metric filling the body.
Data tables are how you build that grid in Excel. Done right, the entire output recalculates automatically whenever your model changes. Done wrong, they silently break and return stale numbers. This article covers both: how to set one up correctly, and how to diagnose it when something goes wrong.

How Data Tables Work
A data table is a What-If Analysis tool. You define two input variables (one for rows, one for columns) and one output. Excel substitutes each combination of input values into the model and records the resulting output in the corresponding cell. The whole table populates in one operation.
The key constraint: the output cell must ultimately trace back through the model to the input cells you specify. If that chain is broken anywhere, the table will populate with numbers, but they won’t mean anything.
Setting Up a Data Table
Step 1: Create a blank table
Lay out the table structure first. The row assumption values go across the top row, starting one cell to the right of the top-left corner. The column assumption values go down the left column, starting one cell below that same top-left corner. Leave the body of the table empty for now.
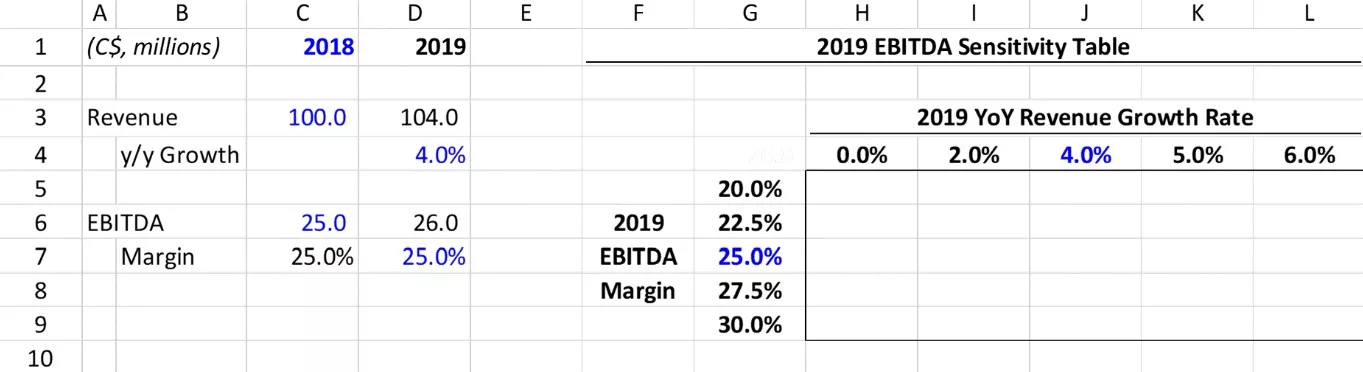
One important note on the headers: the values in the top row and left column must be standalone numbers, not linked to the original assumption inputs in your model. If the headers are linked to the input cells you plan to use as row/column inputs, the data table will error out.
Step 2: Link the top-left cell to the output
Click into the top-left cell of the table (the corner cell where the row and column headers intersect) and enter a formula linking it directly to the output you want to sensitize. If you’re building an EBITDA sensitivity table, link it to the EBITDA cell in your model.
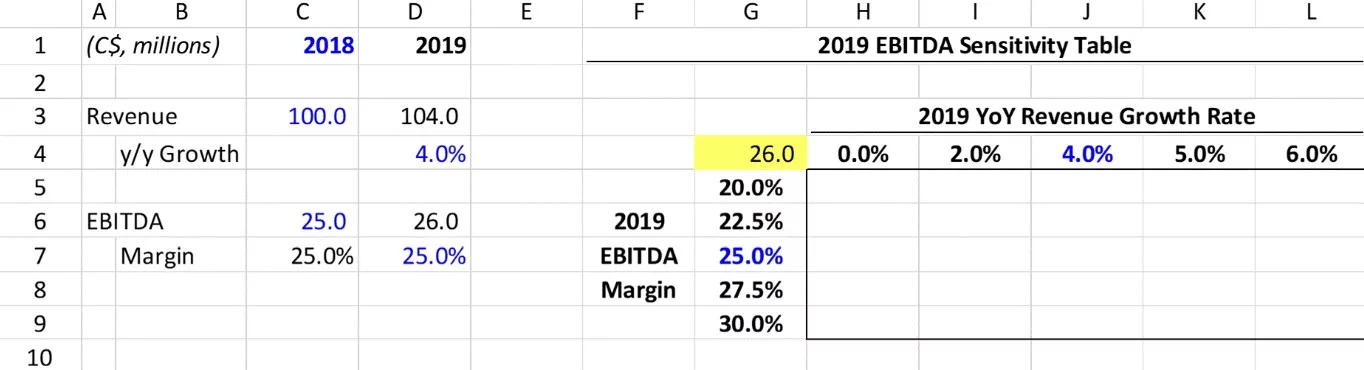
This cell drives what the table calculates. Whatever output it points to is what Excel will recalculate across every combination of inputs.
Step 3: Run the data table tool
Select the entire table range, including the top-left cell, the headers, and the empty body. Then navigate to Data > What-If Analysis > Data Table.

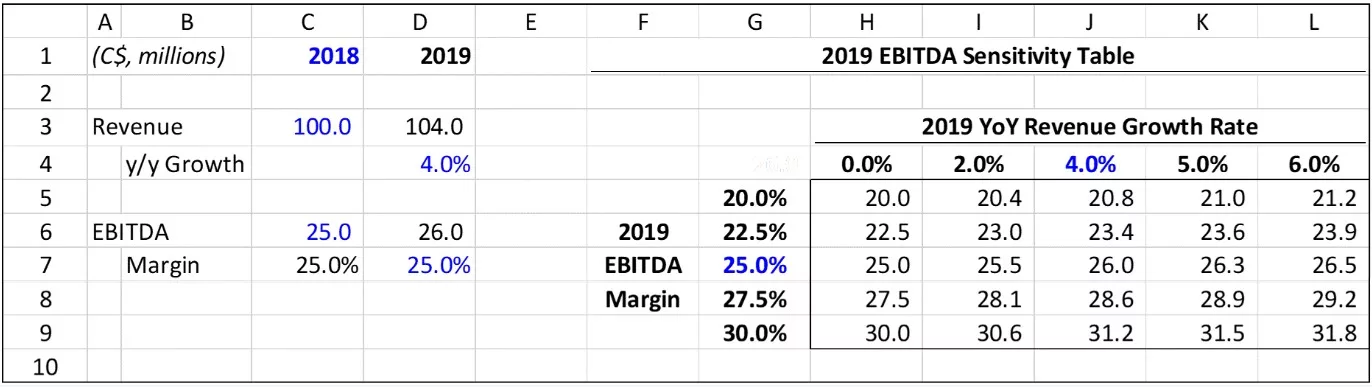
Two fields appear: Row input cell and Column input cell. These are the cells in your model that the header values will be temporarily substituted into. The row input cell corresponds to whatever assumption drives the values across the top. The column input cell corresponds to the values down the left side. Click OK and Excel populates the body of the table.
Step 4: Format the table
Hide the top-left cell by setting its font color to white. It contains the output formula and needs to stay there, but displaying it would make the table look broken. Then apply whatever number formatting and conditional color-coding the output requires.
Troubleshooting Data Tables in Excel
Data tables fail in predictable ways. If yours isn’t working, one of the following six issues is almost certainly the cause.
1. Calculation settings are slowing the model down
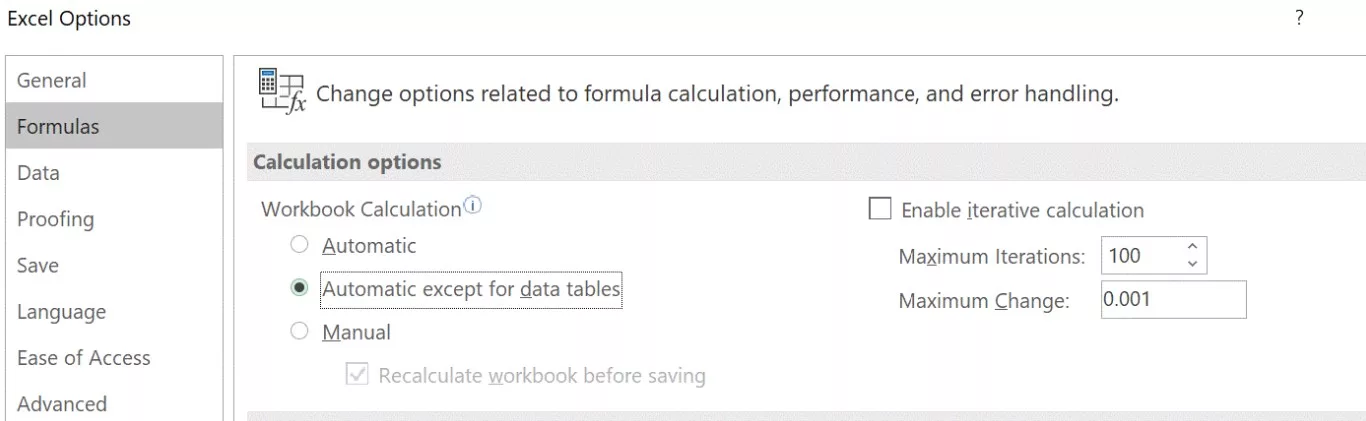
By default, Excel recalculates every data table in the workbook every time any cell changes. In large models with multiple sensitivity tables, this can make the file nearly unusable. Go to Formulas > Calculation Options and switch to “Automatic Except for Data Tables.” The tables will still recalculate when you press F9, but they won’t trigger on every keystroke.
2. Row and column inputs are reversed
If the table populates but the numbers look wrong, the most common cause is that the row and column input cells are swapped. Go back into Data > What-If Analysis > Data Table and switch the two fields. This is easy to do and easy to miss during setup.
3. Headers are linked to the input cells
The assumption values across the top row and down the left column cannot reference the same cells you’re using as row and column inputs. If they do, Excel creates a circular reference when it tries to substitute values, and the table breaks. The headers need to be independent numbers.
4. The data table is on a different sheet from the inputs
Everything needs to live on the same worksheet. The table itself, the output formula in the top-left cell, and the input cells referenced in the row/column input fields must all be on the same tab. Cross-sheet data tables don’t work.
5. Inconsistent cell locking
If some cells in the table body are locked and others aren’t, Excel may refuse to run the table or throw an error on recalculation. Select the entire table and apply consistent formatting: either all cells locked or all unlocked. This usually only surfaces when the sheet is protected, but it’s worth checking if nothing else explains the problem.
6. Trying to edit inside the table
Excel treats the body of a data table as an array. You can’t delete individual cells, insert rows or columns within it, or modify a subset of cells. Any attempt will return an error. To change the structure, delete the entire table body and rebuild it. To add rows or columns of assumption values, extend the headers outside the current table range and re-run the tool over the expanded selection.
Troubleshooting Quick Reference
| Problem | Fix |
|---|---|
| Model recalculates slowly | Set calculation to “Automatic Except for Data Tables” in Formulas > Calculation Options |
| Numbers look wrong | Swap the row and column input cell assignments |
| Table errors on run | Check that headers are not linked to the input cells |
| Table returns zeros or doesn’t update | Confirm the table and all inputs are on the same worksheet |
| Error on protected sheet | Select entire table and apply consistent lock/unlock status to all cells |
| “Cannot change part of a data table” error | Delete the full table body and rebuild; do not edit individual cells within the array |
If you want to take this further, these are the two courses worth looking at.
Applied Excel
Become a Master in Excel for Finance
Advanced formula construction, model architecture, shortcuts, data manipulation, and modeling pitfalls. Covers the structural discipline that keeps complex models navigable under pressure.
Mastering Excel Bundle
Self-Paced Excel Training for Finance
Works from Excel fundamentals through to advanced modeling technique. Built for analysts who want real fluency, not just familiarity with the basics.