Below is a completed Python program that illustrates the power and ease of “scraping” data from websites. The program uses the Yahoo Finance API to create a quick comparable analysis (“comps”) table using live data feed from Yahoo’s website. At the very end of the program, Python exports the data into Excel. You can copy and paste the code from the end of this article or download the completed file here.
Within this article, we will explain at a high level what the program is doing and how it could be modified to retrieve a different set of companies and different sets of financial metrics. No extensive knowledge of Python or coding is needed; however, it is recommended to have a basic understanding of how to use an IDE (Integrated Development Environment) to run the Python code. In the screenshots below we have used Spyder; if you require installation instructions you can view them here.
Quick Background on Web Scraping and JSON
Feel free to skip this section if you are familiar with APIs and know what web scraping is.
Web “scraping” is a generic term used by programmers that essentially means aggregating or extracting data from websites. Scraping can be done by opening a browser from within a programming language, navigating to a specific website and then downloading the data from that web page either directly into the programming language or as separate files. Sometimes, a browser doesn’t even need to be opened and the coding can access the server directly where the data is being stored.
Web scraping can be one of the easiest but also one of the hardest things to code in a programming language, due to the complexity and variability in how information is stored on websites. For more complex websites, you usually need to know a little bit of web design (HTML, CSS, JavaScript) and also a bit of trial and error to get the data downloaded in the proper format.
Luckily, great data providers have something called an “API” (Application Program Interface) which helps the process of downloading data from their websites into different external programs (Excel, Python, VBA, etc.). Unfortunately, usually these data providers also charge money to use their API.
One common approach to sharing data through APIs is using JSON (JavaScript Object Notation), which stores data in a particular way using something called key:value pairs. Think of keys as the column headings in a table and the values as the data inside each column. For the Yahoo Finance example below, each website link is a link to a JSON web page that shows financial data for one particular ticker or company.
For example, this link will take you to the JSON output for Apple from Yahoo Finance and provides live data (usually 15 min delayed) on Apple’s current share price, volume traded, different financial ratios (P/E, P/B, etc.).
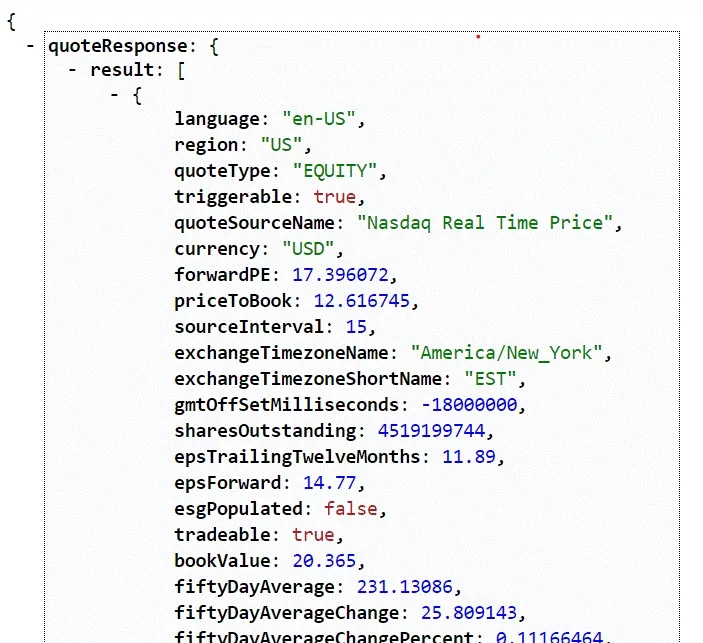
From the screenshot above, you can see a few patterns with JSON pages:
- Data is outputted within braces or “curly” brackets: { }
- There are usually different layers of data and braces; in this case at the top level there is “quoteResponse”, then “result”, and then finally each metric
- Each metric is provided in a key: value format and separated by commas
In most programming languages, working with JSON API’s takes a bit of work because a lot of text manipulation is needed to go from data being stored in key:value pairs and separated by commas and braces to data stored in simple Excel tables.
Luckily for us Python has a JSON package that lets us easily manipulate this type of data. The program below runs in under 50 lines of code, while other programming languages would require double the amount of lines.
Yahoo Finance Program Explained
The program at the end of this article is split into four main sections:
- Importing required packages
- Function that links to Yahoo’s API
- Main program that aggregates data for different tickers
- Output of results in a “regular” table in Excel
1) Importing Required Packages
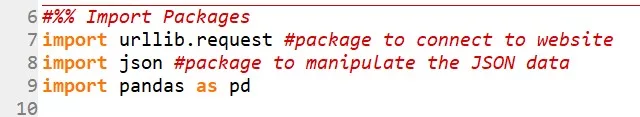
Half the battle in Python is just knowing what packages to import. In this case we will be using three different packages:
- request will be used to create the connection to the Yahoo Finance website
- json will be used to convert the JSON output into usable data in Python
- pandas is used to store the data in something called “DataFrame”, Python’s version of a “table”; this will make it easier to manipulate data inside Python and also export the information as a table in Excel
2) Function that Links to Yahoo’s API
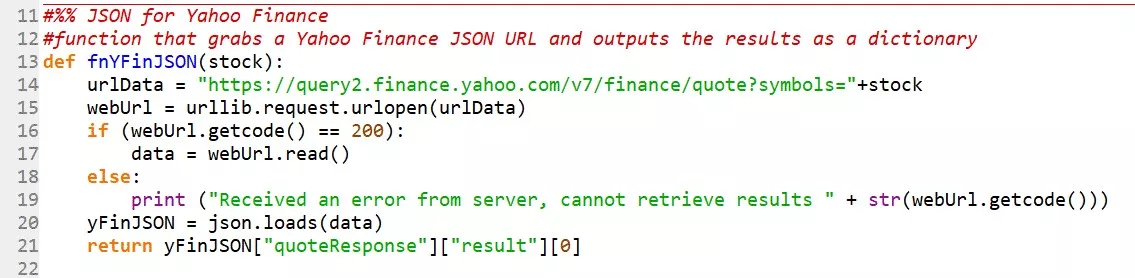
This section of the program creates a general function that can take any ticker symbol as an input and downloads the data from Yahoo Finance. The code was setup as a function so that it can be easily reused for multiple tickers/companies at the same time. Instead of writing the same chunk of code multiple times in our program, we only write it once as a general function and then “call” that function by using something like: fnYFinJSON(“AAPL”) or fnYFinJSON(“MSFT”). Each time the function is called, it will return the data for that ticker in a Python-friendly format.
The function first creates a variable called urlData that contains the link to the appropriate ticker, be it Apple, Microsoft or another company.
The function then “visits” the web page using the urllib.request.urlopen() function that already exists within the urllib package that we imported and then stores the webpage in a variable called webURL.
The IF statement on lines 16 to 19 checks to see if there was any error accessing the web page (sometimes your firm might have a firewall preventing programs from accessing websites, or the ticker you provided doesn’t actually exist). The if statement checks to see if there is a code “200” that comes back as a response. Think of this as the opposite of the 404 error web page you typically see in a browser if the link you typed in is incorrect. If the urllib package receives a 200, everything is good to go, and we then “read” the contents of the website into a variable called data.
This data variable contains the “raw” unformatted text output of the JSON web site. To do anything meaningful with it, we then easily break it apart using Python’s json package on line 20, and store it in the variable yFinJSON:
yFinJSON = json.loads(data)
The last line in this section is a bit trickier, due to how Yahoo Finance structured the output. As we mentioned in the Web Scraping section above, the actual data is a couple layers deep, so we’re telling Python to go inside the “quoteResponse” layer, then the “result” layer, and then take item 0, which is essentially the database of all the financial data.
3) Main Program that Aggregates Data
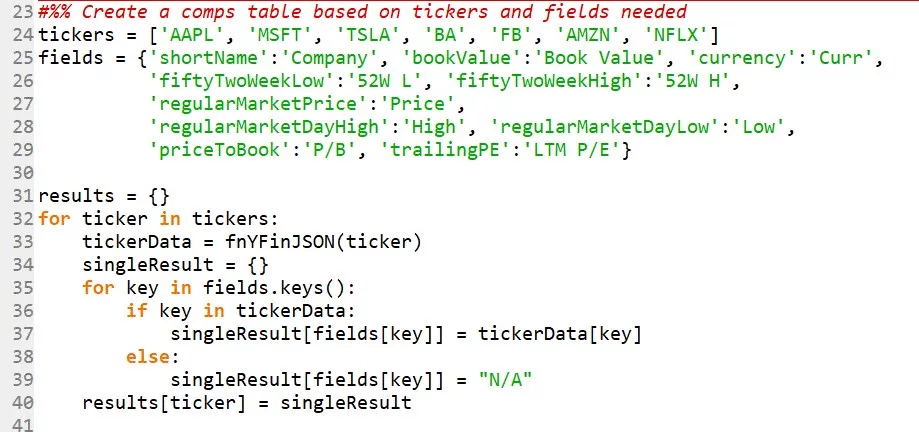
Lines 23-40 of the code is the main part of the program. This is the section that can be customized to create a comps table for different tickers and different financial metrics.
- Line 24: The list of companies is stored as ticker symbols in an array variable called tickers; you can easily add or delete any ticker names from here as long a you surround them in single or double quotation marks (stored as text or string)
- For TSX listed companies, you can add .TO to the end of the ticker (e.g. BlackBerry would be ‘BB.TO’
- Note: arrays are called lists in Python and are written with square brackets
- Lines 25 to 29: The list of financial metrics are stored in the variable fields which is a special type of array called “dictionary” in Python; these are similar to JSON pages where the values are stored within braces { }, and in pairs of key:value
- In this case the “keys” are the fields that display on the Yahoo Finance JSON web page and the values are custom headings that will show up in the Excel output table
- Feel free to change the custom names after the colons and add or delete any key:value pair that you see on the website
- Take a look at one of the web pages in your browser to see what other fields exist: https://query2.finance.yahoo.com/v7/finance/quote?symbols=AAPL; the field names should be self-explanatory (e.g. trailingAnnualDividendYield should be the yield of last year’s dividends on the current share price)
- Lines 31 to 40: This is a generic “for” loop that will cycle through all the ticker symbols in the tickers variable, will access the corresponding Yahoo Finance website using our generic function that we created in Section 1, and store the data in a new “dictionary” array called results
- We have nested a second for loop that only extracts the metrics we care about from the fields dictionary
- The IF statement checks to see if a field actually exists; if it doesn’t it will store a generic “N/A” as the value
- As you will see in the output at the end, some companies might not have all the metrics (e.g. Tesla will not have a Last Twelve Months Price to Earnings ratio)
4) Output of Results
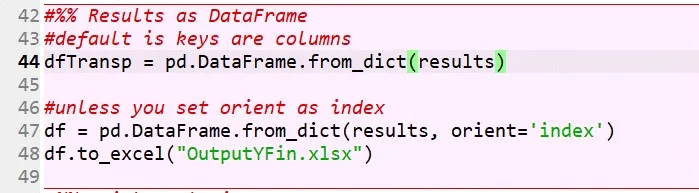
This last section aggregates all the extracted results in a more usable table called a DataFrame. Depending on how you like your output data displayed, you only need to use one of either lines 44 or 47.
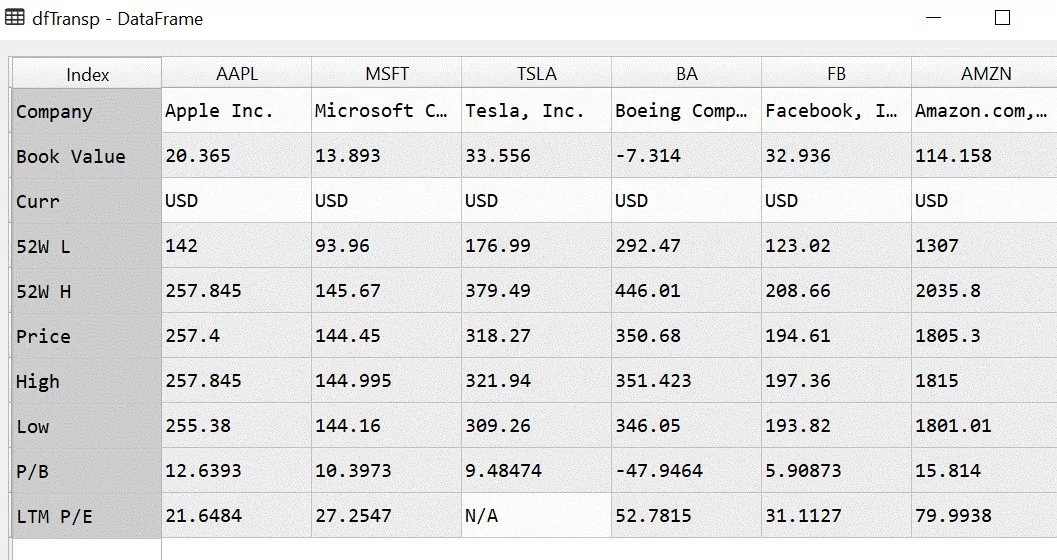
Line 44 will store the information in columns, with each ticker as a separate column:
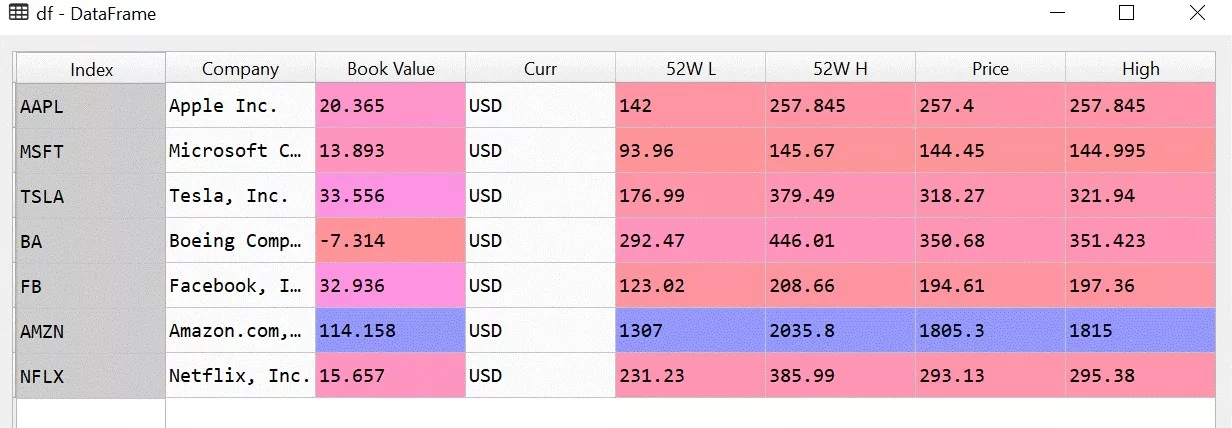
Line 47 will store the data in the more standard format, with each company as a row and metrics in columns:
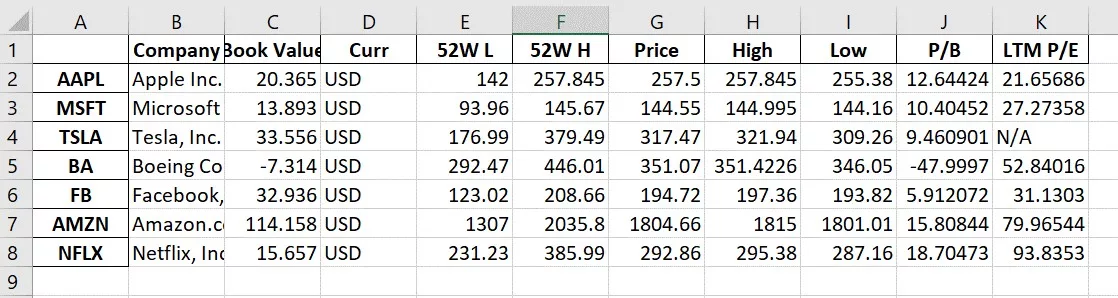
At the very end, line 48 will output the information into an Excel file called OutputYFin.xlsx. If the file already exists (from a previous run of the program), Python will just overwrite the file with new data.
If you have any questions about the code or want to learn more about our Python course, feel free to reach out here.
Below is the output of the entire code:
# -*- coding: utf-8 -*-
"""
Program creates a quick comps table using live data from Yahoo Finance

"""
#%% Import Packages
import urllib.request #package to connect to website
import json #package to manipulate the JSON data
import pandas as pd

#%% JSON for Yahoo Finance
#function that grabs a Yahoo Finance JSON URL and outputs the results as a dictionary
def fnYFinJSON(stock):
    urlData = "https://query2.finance.yahoo.com/v7/finance/quote?symbols="+stock
    webUrl = urllib.request.urlopen(urlData)
    if (webUrl.getcode() == 200):
        data = webUrl.read()
    else:
        print ("Received an error from server, cannot retrieve results " + str(webUrl.getcode()))
    yFinJSON = json.loads(data)
    return yFinJSON["quoteResponse"]["result"][0]

#%% Create a comps table based on tickers and fields needed
tickers = ['AAPL', 'MSFT', 'TSLA', 'BA', 'FB', 'AMZN', 'NFLX']
fields = {'shortName':'Company', 'bookValue':'Book Value', 'currency':'Curr',
          'fiftyTwoWeekLow':'52W L', 'fiftyTwoWeekHigh':'52W H',
          'regularMarketPrice':'Price',
          'regularMarketDayHigh':'High', 'regularMarketDayLow':'Low',
          'priceToBook':'P/B', 'trailingPE':'LTM P/E'}

results = {}
for ticker in tickers:
    tickerData = fnYFinJSON(ticker)
    singleResult = {}
    for key in fields.keys():
        if key in tickerData:
            singleResult[fields[key]] = tickerData[key]
        else:
            singleResult[fields[key]] = "N/A"
    results[ticker] = singleResult

#%% Results as DataFrame
#default is keys are columns
dfTransp = pd.DataFrame.from_dict(results)

#unless you set orient as index
df = pd.DataFrame.from_dict(results, orient='index')
df.to_excel("OutputYFin.xlsx")