In our previous article, Python Packages 101 – Part 1, we introduced the first 10 Python packages of our top 25 list. Those packages focused on data manipulation, web scraping and visualization. In this article we will provide an overview of the remaining 15 packages in the following more advanced categories:
- Dashboarding: Dash; Streamlit
- File management: OS; Pathlib; Shutil; Pillow; Camelot; Tabula
- Statistical analysis: Statsmodels; SciPy
- Machine learning: Scikit-learn; NLTK; SpaCy; OpenCv; PyTesseract
Dashboarding Packages
In our last article we discussed several visualization packages, such as Plotly and Bokeh, that provide the capability of creating interactive charts and the “feel” of dashboarding software programs such as Tableau and Microsoft’s Power BI. Python also has several packages that can allow for the creation of more complex dashboards with interactive dropdowns, radio buttons and sliders that can control multiple charts and outputs at the same time.
There are two main competing popular packages for creating dashboards in Python:
- Dash, designed by the same creators of Plotly : https://plotly.com/dash/
- Streamlit, designed by engineers from Google and Twitter: https://www.streamlit.io/
Both packages are free and allow for the creation of fairly complex dashboards with very few lines of code. The dashboards open as stand-alone websites in your browser by running them locally on your computer or by hosting them in an online cloud service such as Microsoft’s Azure or Amazon’s AWS. The functionality and primary uses are similar for both packages and described in the summary table below. The two packages differ in that:
- Dash allows for more customization and formatting; however, it is a bit more of a learning curve and requires some minimal knowledge of web design coding (HTML tags and CSS for styling)
- Streamlit does not allow for as much customization in formatting; however, it is more streamlined and easier to use for coders with no web design knowledge or experience
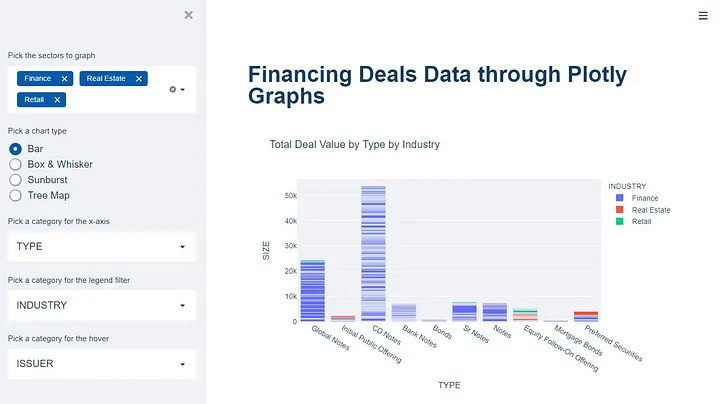
Figure 1: Streamlit Dashboard
Dash
Documentation: https://dash.plotly.com/
Gallery: https://dash-gallery.plotly.host/Portal/
Streamlit
Documentation: https://docs.streamlit.io/en/stable/
Gallery: https://streamlit.io/gallery
Functionality
- Dashboard is launched as a new tab in your browser as a “web app”
- The web app can be hosted locally on your computer or shared drive or can be uploaded to an online server (e.g. Amazon AWS, Google Collaborate, Microsoft Azure, etc.)
- Both allow for “debugging” on the fly being able to see the changes to the dashboard as changes are made in the code without having to relaunch the web app
- Integration with visualization packages such as Plotly and matplotlib
Primary Uses
- They allow for rapid deployment of a dashboard with very minimal or no web design experience
- They allow for creating interactive elements that will filter and update your charts and DataFrames on the fly, such as dropdowns, radio buttons, sliders, checkboxes, buttons, etc.
Use in Finance
- Creating a portfolio dashboard to view profits and losses, IRRs and current valuation metrics of investments with capability of filtering by sector, accounts, time periods and currency
- Creating a client invoices dashboard to view revenue generated by client, types of product, time periods, and geography
File Management
Python can also be used to automate tedious and repetitive tasks such as creating, opening, copying, renaming and deleting folders and files. Three main packages are used for folder and file management and are typically pre-installed with Python:
- OS
- Pathlib
- Shutil
The above packages have very similar uses with slight differences in how they handle some of the functionality (e.g. OS model allows for copying or deleting of a single folder, vs. Shutil allows for deleting folders and all their contents including subfolders).
Other packages are more proficient at handling one specific type of files. For example, Pillow is the go-to package for handling images in Python and Tabula and Camelot are two powerful packages for extracting tables out of PDF files.
File and Directory Management Packages
OS: https://docs.python.org/3/library/os.html
Pathlib: https://pathlib.readthedocs.io/en/pep428/
Shutil: https://docs.python.org/3/library/shutil.html
Functionality
- Access and control to operating system files and folders
- Opening and closing files
- Copying, renaming, moving, and deleting files and folders
Primary Uses
- Organizing hundreds of files and folders in an automated way
- Grabbing a list of all file names of one file type in a folder (e.g. all CSVs or PDFs)
- Cleaning up the names of multiple files
Use in Finance
- Creating a data room for a financial transaction (e.g. merger or acquisition) with custom named folders and files using a summary table from Excel
Pillow
Website: https://python-pillow.org/
Documentation: https://pillow.readthedocs.io/en/stable/handbook/index.html
Functionality
- Pillow is the friendlier, easier to use version of the PIL (Python Imaging Library) package in Python
- It provides image processing capabilities within Python and can handle and extensive list of image file formats such as PNG, JPEG, GIF, BMP, EPS and others
- Cropping, resizing and editing contents of images
Primary Uses
- Opening and closing images in Python
- Creating thumbnails of multiple images
- Applying image filters such as smooth, blur, sharpen, contour and others
- Converting multiple images from one file format (e.g. JPG) to another (e.g. PNG)
Use in Finance
- Open pictures of deal “tombstones” to be later analyzed and extract text with other OCR packages
- Import multiple logos of potential investment companies to be resized and cleaned up for a pitch presentation
PDF Packages
Tabula
Documentation: https://tabula-py.readthedocs.io/en/latest/
Camelot
Documentation: https://camelot-py.readthedocs.io/en/master/
Comparison to Tabula: https://github.com/camelot-dev/camelot/wiki/Comparison-with-other-PDF-Table-Extraction-libraries-and-tools
Functionality
- Extract tables from PDFs
- Convert PDF tables into Pandas DataFrames
- Convert PDFs into CSV, JSON, HTML, Excel and other formats
- Dynamically find data based on keywords inside the tables
- Visualize the tables being extracted
- Finetune settings to account for tables with no borders and whitespaces between table cells
Primary Uses
- Create data sets from multiple PDF files
- Extract, clean and convert tables from PDFs into Excel format in a more efficient and automated manner
Use in Finance
- Extract, clean and convert tables from PDFs into Excel format in a more efficient and automated manner
- Extract key data from tables in SEC filings and financial reports
- Consolidate portfolio transactions from multiple PDF files from brokerage accounts
- Capture industry data from tables stored in PDF files
- Convert tables research reports into Excel files

Statistical Analysis
There are two core packages used by data scientists in Python to perform typical statistical analysis: statsmodels and SciPy. A third package, Scikit-learn, is used for more advanced machine learning algorithms and is described in the following section.
Statsmodels
Website: https://www.statsmodels.org/stable/index.html
Documentation: https://www.statsmodels.org/stable/gettingstarted.html
Functionality
- Conducting statistical tests
- Classes and functions for estimation of many different statistical models
- Statistical data exploration
- Integration with Pandas DataFrames
Primary Uses
- Linear regression and time series analysis
- OLS regression results, including R-square d, F-stats, and confidence intervals
Use in Finance
- Linear regression to calculate beta for CAPM (Capital Asset Pricing Model)
- Time series analysis using ARIMA model
- Calculating betas of multiple factors in a portfolio using a multivariate linear regression model
SciPy
Website: https://www.scipy.org/
Documentation: https://docs.scipy.org/doc/scipy/reference/
Functionality
- Provides functions in mathematics, science and engineering
- Similar functions to other statistical programs such as MATLAB and Octave
- Functions built on top of the Numpy package
Primary Uses
- Includes common numerical functions, including integration, optimization, interpolation, Fourier transforms and many others
- Linear algebra applications
Use in Finance
- Portfolio optimization using minimization function to find the optimal weights of investments and minimizing volatility at a given required portfolio return
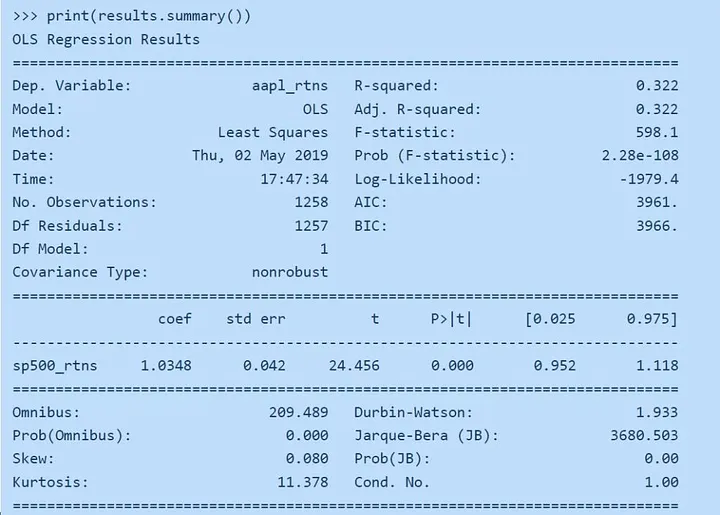
Figure 3: OLS Results from statsmodels
Machine Learning Algorithms
Python has become very popular in the data science community due to the large amount of Machine Learning and AI algorithms available through third party packages.
Scikit-learn is the most used package for Machine Learning and has algorithms for the following applications:
- Classification: identifying which category an object belongs to; e.g. after training a model what is spam and what is not, the classifier model will “classify” new emails
- Regression: predicting continuous valued attributes associated with independent variables; e.g. predicting returns of portfolio based on certain factors (market risk premium, size premium, etc.)
- Clustering: automatic grouping of similar objects into sets; e.g. allocating customers into different categories based on spending habits and other characteristics
Scitkit-learn
Website: https://scikit-learn.org/stable/
Documentation: https://scikit-learn.org/stable/getting_started.html
Functionality
- One of the core machine learning packages in Python community
- Provides machine algorithms such as classification, regression, cluster detection, dimensionality reduction, data preprocessing and model selection
- Cleaning and preparing datasets for forecasting models: splitting data sets into testing vs training data, creating dummy variables for categorical fields, eliminating outliers
- Model evaluation: fine-tuning model parameters and analysing overfitting, comparing R-squared metrics and other model scores
Primary Uses
- Forecasting more complex data that can’t be easily modeled using a linear regression model
- Categorizing data in an automatic fashion
Use in Finance
- Determining credit rating of a company based on multiple independent variables, both numerical and categorical
- Finding the optimal capital structure and debt capacity of a company
- Determining the target price of a company using multiple key financial ratios and historical financials of a company
- Classifying customers of a company by spending habits to refine revenue buildup assumptions in an operating model
There are also higher level artificial intelligence packages that have been “trained” and perfected over the years with machine learning algorithms that can be used right away in practical applications:
- OCR — Optical Character Recognition
- NLP — Natural Language Processing
Optical Character Recognition (OCR) is a branch of AI that allows computers to recognize text in images or scanned documents. The steps for using OCR in Python are:
- Load an image into Python using an imaging package that processes the picture
- Use an OCR package to analyze the image and extract any text
The image processing is usually achieved with a package such as OpenCV and Google’s Tesseract is used for the text recognition.
In addition, Natural Language Processing (NLP) is a branch of machine learning and AI that allows computers to understand human language and classifies and groups togethers parts of text to extract key information. NLP is used on a daily basis in interactions with Google Home, Siri, Alexa and chatbots and in the finance and business community it is primarily used to extract key data from press releases and articles. It is also used to an extent to determine the “sentiment” of an article, tweet, filing etc. Two popular Python packages used for NLP are NLTK and SpaCy.
OpenCV
Website: https://opencv.org/
Documentation: https://docs.opencv.org/master/
Functionality
- Open source computer vision and machine learning software library
- Used to open, process and transform images
- Used to identify special objects in pictures (e.g. eyes, faces, trees, etc.)
Primary Uses
- Used to open and process images before text is extracted with more advanced packages such as Tesseract
Use in Finance
- Open multiple scanned images of legal documents
- Open and process logos of companies
PyTesseract
Website: https://opensource.google/projects/tesseract
Documentation: https://github.com/madmaze/pytesseract
Functionality
- PyTesseract is the Python implementation of Google’s Tesseract technology
- Supports multiple image formats, including images processed from OpenCV or Pillow packages
- Supports multiple languages
Primary Uses
- Extracts and converts text from images into Python strings
Use in Finance
- Extract all text from scanned purchase agreements
- Extract company names and financial figures from hundreds of deal “tombstones”
NLP Packages
NLTK
Website: http://www.nltk.org/
Documentation: https://github.com/nltk/nltk/wiki
SpaCy
Website: https://spacy.io/
Documentation: https://spacy.io/usage
Functionality
- Tokenization: Segmenting text into words, punctuation marks,
- Part of Speech (POS) Tagging: Assigning word types to tokens, e.g. verb or noun
- Named Entity Recognition (NER): Labelling named “real world” people, companies and locations
- Text Classification: Assigning categories or labels to a whole document, or parts of a document
- Both packages have models of “taught” words that act as starting dictionaries
Primary Uses
- Extracting key words from press releases, essays, and text documents
- Translating words from one language to another
- Analyzing sentiment of articles
Use in Finance
- Extracting key information from SEC filings
- Summarizing a company’s quarterly earnings press release seconds after it is filed
- Extracting all companies mentioned, dates and financial figures from hundreds of articles on an industry website
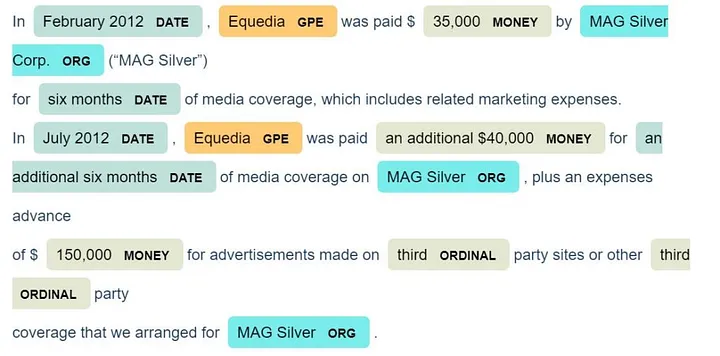
Figure 4: Extracted key words using SpaCy
Cheat Sheet and Next Article
Below is a link to a cheat sheet summarizing all packages discussed in the Part 1 & Part 2 articles. The cheat sheet provides a summary of all the packages, their categories, conda codes to install these packages with Anaconda. As well as links to the documentation and Anaconda Repo.
Python Packages — Cheat Sheet.pdf
We hope you enjoyed this series of articles and if you have any further questions, please reach out to us.
Learn with Training Street
Training The Street’s Python training:

Python Training Public Course
With our Python for finance course, students will gain the skills needed to develop Python programs. This will help solve typical Finance problems, cutting through the noise of generic “Data Science” courses.
Python Training course options:
- Python 1: Core Data Analysis
- Python 2: Visualization and Analysis
- Python 3: Web Scraping and Dashboarding

Self-Study: Python Fundamentals Course
Learn programming for business and finance professionals

Self-Study: Applied Machine Learning Course
Apply custom machine learning algorithms with Python