You have decided to learn Python and you have even picked up the basics such as While and For loops, If statements and using lists and dictionaries. Now you want to get serious and have no idea what to learn next. All of your Python expert friends keep throwing around silly names such as Pandas, Beautiful Soup, Seaborn and Spacy and you are not sure where to start.
If that sounds all too familiar, fret not! This article will guide you through the must know items to set up and use Python effectively, including:
- A quick overview of the top packages used by data scientists and financial professionals in Python organized in practical categories
- A cheat sheet of all the popular packages along with their respective codes needed to install these packages with Anaconda and links for more documentation
This article profiles the top packages that bring core functionality to Python and allow you to perform key data tasks efficiently. Our upcoming second article in this two-part series will discuss:
- An overview of packages for additional categories such as statistical analysis and machine learning
- An overview of Anaconda and a guide on how to find, install and update packages with Anaconda
Popular Packages
Python has been around for more than 30 years. However, what has really made it popular over the last decade has been the introduction of popular packages such as Pandas (released in 2008, used for data manipulation) and Beautiful Soup (released in 2004, used for web scraping). These packages are created by other developers in the community and submitted to package repositories such as PyPI (Python Package Index) and the Anaconda Repo. As of this article’s date (March 2021), there are more than 290,000 packages on PyPI, which could be very overwhelming for a programmer new to Python.
We have picked 25 of the top packages used by business professionals that are also taught in our Python Public Course. All of these packages are free to download and use with Python and can be easily installed with the Anaconda software. We have broken these top packages into the following categories:
- Data manipulation: NumPy; Pandas
- Web scraping: Beautiful Soup; Selenium; Requests; Urllib3
- Visualization: Matplotlib; Seaborn; Bokeh; Plotly
In our follow-up article we will also cover packages in the following more advanced categories:
- Dashboarding: Dash; Streamlit
- Statistical analysis: Statsmodels; SciPy
- File management: OS; Pathlib; Shutil; Pillow; Camelot; Tabula
- Machine learning: Scikit-learn; NLTK; SpaCy; OpenCv; PyTesseract
Data Manipulation Packages
Data manipulation is one of the most common uses of Python by business and finance professionals. Some data sets are too large to work with in Excel and Python allows for very quick and automated manipulations such as cleaning up data sets, sorting, filtering, lookups and quick statistical analysis. However, storing complex data in Python’s built-in lists and dictionaries structures can be inefficient or tedious to work with. That is where additional packages such as NumPy and Pandas come in to help with more advanced data manipulations and analysis.
NumPy
Website: https://numpy.org/
Documentation: https://numpy.org/doc/stable/
- Provides a powerful set of mathematical and statistical functions
- Stores data in NumPy arrays, multi-dimensional arrays that are similar to matrices in MATLAB
- Examples of use cases in finance: calculating log returns of share prices; calculating variance and covariance of multiple stocks in a portfolio; generating random returns that follow a normal distribution
Pandas
Website: https://pandas.pydata.org/
Documentation: https://pandas.pydata.org/docs/
Cheat sheet: https://pandas.pydata.org/Pandas_Cheat_Sheet.pdf
- One of the most popular packages in Python used for data manipulation and analysis; often quoted as the “Excel” for Python by business professionals
- “Stands” for Python Data Analysis Library (name derived from “panel data”)
- Allows Python to handle cross sectional or time series data easier
- Stores data in a “DataFrame”, a tabular structure that allows for storing multi-dimensional data (think Excel tables with rows and columns)
- You can import data and convert it to DataFrames from a variety of sources (Excel and CSV files, SQL databases, tables on HTML websites, JSON files, etc.)
- Provides built in functionality to handle typical missing data, reshaping, merging, filtering, sorting, and other operations
- Examples of use cases in finance: calculating moving averages of share prices; converting portfolio holdings data from daily to monthly or yearly; aggregating client trades from multiple files; creating correlation matrices of stocks in a portfolio; creating pivot tables to summarize deal data by sector, type, underwriter, company, dates, etc.
Web Scraping Packages
Web “scraping” is a generic term that means aggregating or extracting data from websites. Scraping can be done by opening a browser from within a programming language, navigating to a specific website and then downloading the data from that web page either directly into the programming language or as separate files. Sometimes, a browser doesn’t even need to be opened and the programming language code can access the data directly from the server. While sometimes simple to do, web scraping can be one of the hardest things to code in a programming language, due to the complexity and variability in how information is stored on websites. For more complex websites, prior knowledge of web design (HTML, CSS, JavaScript) is helpful; however, with a bit of trial and error, and by using the web scraping packages available in Python, one can quickly get the data downloaded in the proper format.
If the data is displayed in a tabular format on the website, it can easily be scraped with the Pandas package mentioned in the previous section. Otherwise, data can be extracted using a combination of the Beautiful Soup package and a package to connect to the website (e.g. requests or urllib3). Selenium is also used if there is a need for interaction with the site (e.g. logging in, clicking on a button, or filling out a form).
Business and finance professionals use web scraping with Python to perform more extensive due diligence on their clients, competitors, or potential investments, such as analyzing store locations or grabbing pricing and inventory information on products.
Beautiful Soup
Website: https://www.crummy.com/software/BeautifulSoup/
Documentation: https://www.crummy.com/software/BeautifulSoup/bs4/doc/
- Allows for more advanced scrapes for data not structured in tables and that cannot be handled by the Pandas read_html() function
- It allows for extracting elements from a website without having to know too much HTML
- It is common practice to import Beautiful Soup along with the Urllib3 or the Requests package
- These additional packages will connect to the sites and grab the HTML code for Beautiful Soup to analyze
- Examples of use cases in finance: grab product data from Wayfair or Amazon’s website (product name, price, vendor, ratings, product description, etc.); grab investments data from a private equity’s portfolio website; find all links and download investor presentations on a company’s investor relations website
Selenium
Website: https://www.selenium.dev/
Documentation: https://selenium-python.readthedocs.io/
- Provides capability of automating web browser interaction directly from Python
- It allows for interacting with web elements such as log in screens, selecting options from dropdowns, clicking on buttons, etc.
- Several browsers are supported, including Firefox, Chrome and Internet Explorer
- Similar to Beautiful Soup, Selenium can also extract key web elements from the HTML code using different identifiers
- Examples of finance use cases: logging into a trading/investments account to download portfolio data and transaction statements; clicking on the “next page” button on retail websites to download multiple pages of product information; inputting text in search boxes to generate results on a website; selecting options in a dropdown to generate a unique link for downloading a CSV file
Urllib3
Website: https://urllib3.readthedocs.io/en/latest/
Documentation: https://urllib3.readthedocs.io/en/latest/user-guide.html
- HTTP package that is used in combination with Beautiful Soup to connect to websites
- Allows for passing of custom headers and parameters when connecting to websites to simulate using specific browsers (e.g. website sees you are coming from Chrome instead of Python) or for requesting specific loading parameters (e.g. request that 100 products are loaded on a page instead of 50)
- Examples of business use cases: connecting to the store locations page of a corporate website and requesting to load a specific number of stores within a 50 km radius of a given address
Requests
Website and documentation: https://requests.readthedocs.io/en/master/
- Another HTTP package that you can use in combination with Beautiful Soup to connect to websites
- Alternative to Urllib3; Requests package actually uses Urllib3 “under the hood”. It has streamlined many functions that exist in Urllib3 to make it simpler to connect to websites and retrieve data
Visualization Packages
When it comes to visualizing data sets, business professionals resort to two extremes for creating charts. On the “quick and dirty” end of the spectrum data analysts have resorted to creating their graphs in Excel. The simple user interface allows for quick creation of charts and customization of all possible chart elements with just a double click away — from the title of the graph to the font and size of the axis labels. However, charts in Excel are usually not interactive and also tedious to update for new data sets or different configurations of displaying the data. On the “premium” end of the spectrum, data analysts use more advanced dashboarding software programs such as Tableau and Microsoft’s Power BI. These programs are great for creating stunning and interactive visualizations; however, they also have a steeper learning curve and usually a cost associated with more advanced features.
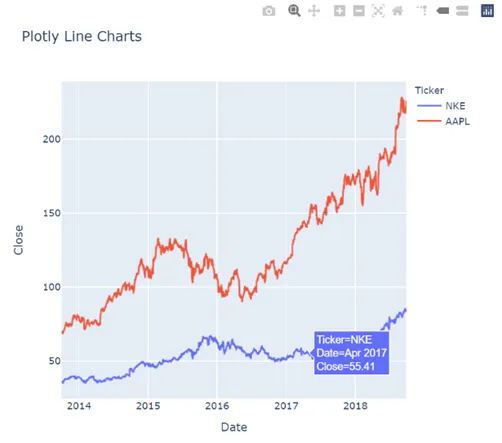
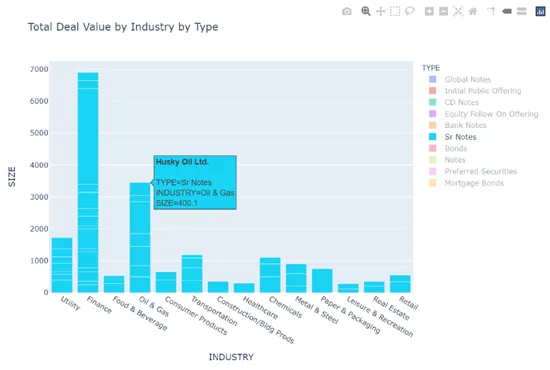
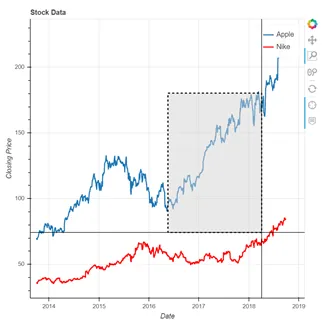
Python visualization packages are a great compromise between these two alternatives. The coding nature of Python allows for the creation and automation of multiple charts in a matter of seconds. Also, by adding small incremental code to the visualization functions, anything from the data labels to the color of the markers can be customized. There are also several packages such as Bokeh and Plotly that allow interactive charts to be exported as stand-alone HTML files that can be shared with colleagues at work. One last important point to mention — all these packages are free to install and use.
Matplotlib
Website: https://matplotlib.org/
Examples Gallery: https://matplotlib.org/stable/gallery/index.html
Documentation: https://matplotlib.org/stable/contents.html
- 2D and 3D visualization package
- Makes graphs similar to those in MATLAB
- Useful for time series and cross-sectional data
- Works very well with the Pandas package — columns from DataFrames can be used as the source data for x and y coordinates on scatter plots, line charts and bar charts
- Charts are highly customizable with custom functions for titles, legends, and annotations
- However, some of the functions are not as intuitive as in other Python visualization packages
- You can export charts as jpg or png files or embedded as outputs in Jupyter Notebook files. This is a web-based coding environment for writing and running Python code
Seaborn
Website: https://seaborn.pydata.org/
Examples Gallery: https://seaborn.pydata.org/examples/index.html
Documentation: https://seaborn.pydata.org/tutorial.html
- Data visualization packaged based on Matplotlib
- It provides a higher-level interface with more streamlined and easier to use functions than matplotlib
- However, it provides less customizations and instead has built-in “styles”
- It provides a higher-level interface with more streamlined and easier to use functions than matplotlib
- However, it provides less customizations and instead has built-in “styles”
Plotly
Website and Examples Gallery: https://plotly.com/python/
- Interactive plotting library that supports more than 40 charts
- Plotly.Express module is part of the Plotly package. It contains functions that allow for creation of entire interactive charts in one or few lines of codes
- Plotly Express documentation: https://plotly.com/python api reference/plotly.express.html
- Plotly also allows for creation of standalone webpages that can be shared with and viewed by teammates who do not have Python installed on their devices
- The charts remain fully interactive and are not just simple pictures as in the case with matplotlib
- Example of interactivity: zooming in on sections of the graph, filtering out categories plotted on the graph by clicking on legend labels, more detailed information being displayed on the graph while mouse is hovering over data points, drilling down on categories in sunburst charts or tree maps
Bokeh
Website: https://docs.bokeh.org/en/latest/index.html
Examples Gallery: https://docs.bokeh.org/en/latest/docs/gallery.html
- Another interactive visualization library that creates charts in standalone webpages
- Contains several modules that allow for customization of different components of the graphs and the layout of the output webpage
- The tools that show up in the side toolbar can be customized (pan, zoom, reset, etc.). Also, extra widgets can be added to charts such as dropdowns, buttons, etc.
- The codes are more complex than Plotly Express but more customizations can be made
Cheat Sheet and Next Article
Below is a link to a cheat sheet summarizing all packages discussed in the Part 1 & Part 2 articles. The cheat sheet provides a summary of all the packages, their categories, conda codes to install these packages with Anaconda. As well as links to the documentation and Anaconda Repo.
Python Packages — Cheat Sheet.pdf
In our next article we will discuss packages used to automate file management (creating, deleting, moving files and folders and importing images and pdf files), run more advanced statistical analysis in business and finance applications (time series analysis, linear regressions and optimization problems), create advanced interactive dashboards for deeper analysis and insights into data sets, and take advantage of advanced machine learning algorithms (NLP — natural language processing, OCR — optical character recognition, advanced forecasting and prediction models).
Learn with Training Street
Training The Street’s Python training:
Python Training Public Course
Through our hands-on Python for finance course, students will gain the skills needed to develop Python programs. This will help solve typical Finance problems, cutting through the noise of generic “Data Science” courses.
Python Training course options:
- Python 1: Core Data Analysis
- Python 2: Visualization and Analysis
- Python 3: Web Scraping and Dashboarding
Python Fundamentals Self-Study Course
Learn programming for business and finance professionals
Applied Machine Learning Self-Study Course
Apply custom machine learning algorithms with Python


